Booster stations, lift stations, and well pumps reporting into one platform: flow, pressure, wet-well level, runtime, and energy per station, with alarms that reach the on-call operator instead of a workstation nobody is sitting at.
24/7 remote monitoring15-20% lower energy costsCross-station leak detectionAutomated compliance reporting
The status quo
Pumping stations were never designed to be run blind
Most water utilities still operate stations with limited visibility, manual rounds, and reactive maintenance. The result is wasted energy, surprise failures, and compliance scrambles every reporting cycle.
01
01 / Visibility pain
Station status still means driving to the station
Booster stations and well pumps sit at the edge of the service area, checked on a rotation measured in days. A pump that tripped at midnight waits for the next round, and everything that happened between visits, the pressure dip, the extra starts, the level swing, goes unrecorded.
02
02 / Energy pain
Pumping is the biggest line on the power bill
Pumps run on rigid schedules or local float logic that ignores tariffs, demand windows, and efficiency curves. A station pumping into peak-rate hours, or a pump operating far off its best efficiency point, burns budget every day without anyone seeing it happen.
03
03 / Reliability pain
Failures are discovered after the fact
Bearing wear shows up as a slow rise in motor current and start counts long before the trip. Cavitation shows up as a flow-to-pressure mismatch. Without trend data per pump, the first sign anyone sees is a dry tank, a low-pressure complaint, or an emergency callout at 2am.
04
04 / Compliance pain
Reporting is a manual fire drill
Flow totals, pressure records, and water quality data live in the SCADA historian, a chart recorder, and an operator logbook. Every reporting cycle, an engineer spends days exporting, copying, and formatting the same numbers the regulator asked for last quarter.
05
05 / Workforce pain
Tribal knowledge walks out the door
One senior operator knows which stations struggle in heavy rain, which alarm is real, and which pump to trust. When that operator retires or takes vacation, the on-call rotation inherits the pumps without inheriting the knowledge.
Use case
One platform for every pumping station you operate
From booster stations to large lift stations, ControlCom Connect gives water utilities a single pane of glass for the entire pumping fleet.
ControlCom Connect connects to the PLCs, VFDs, and instrumentation already installed at each station over Modbus TCP/RTU, OPC-UA, EtherNet/IP, BACnet, and MQTT, alongside 4-20mA flow meters, pressure transmitters, and level sensors. A containerized edge agent at each site collects locally and syncs to the cloud; stations on cellular backhaul buffer readings through outages and forward them when the link returns, with typical telemetry staying under 50 MB per month per site. Threshold alarms evaluate at the edge, so a high-level or low-pressure alarm fires even when the backhaul is down. It is the same remote-site architecture that runs oil and gas fields: unmanned assets, far apart, on links that come and go.
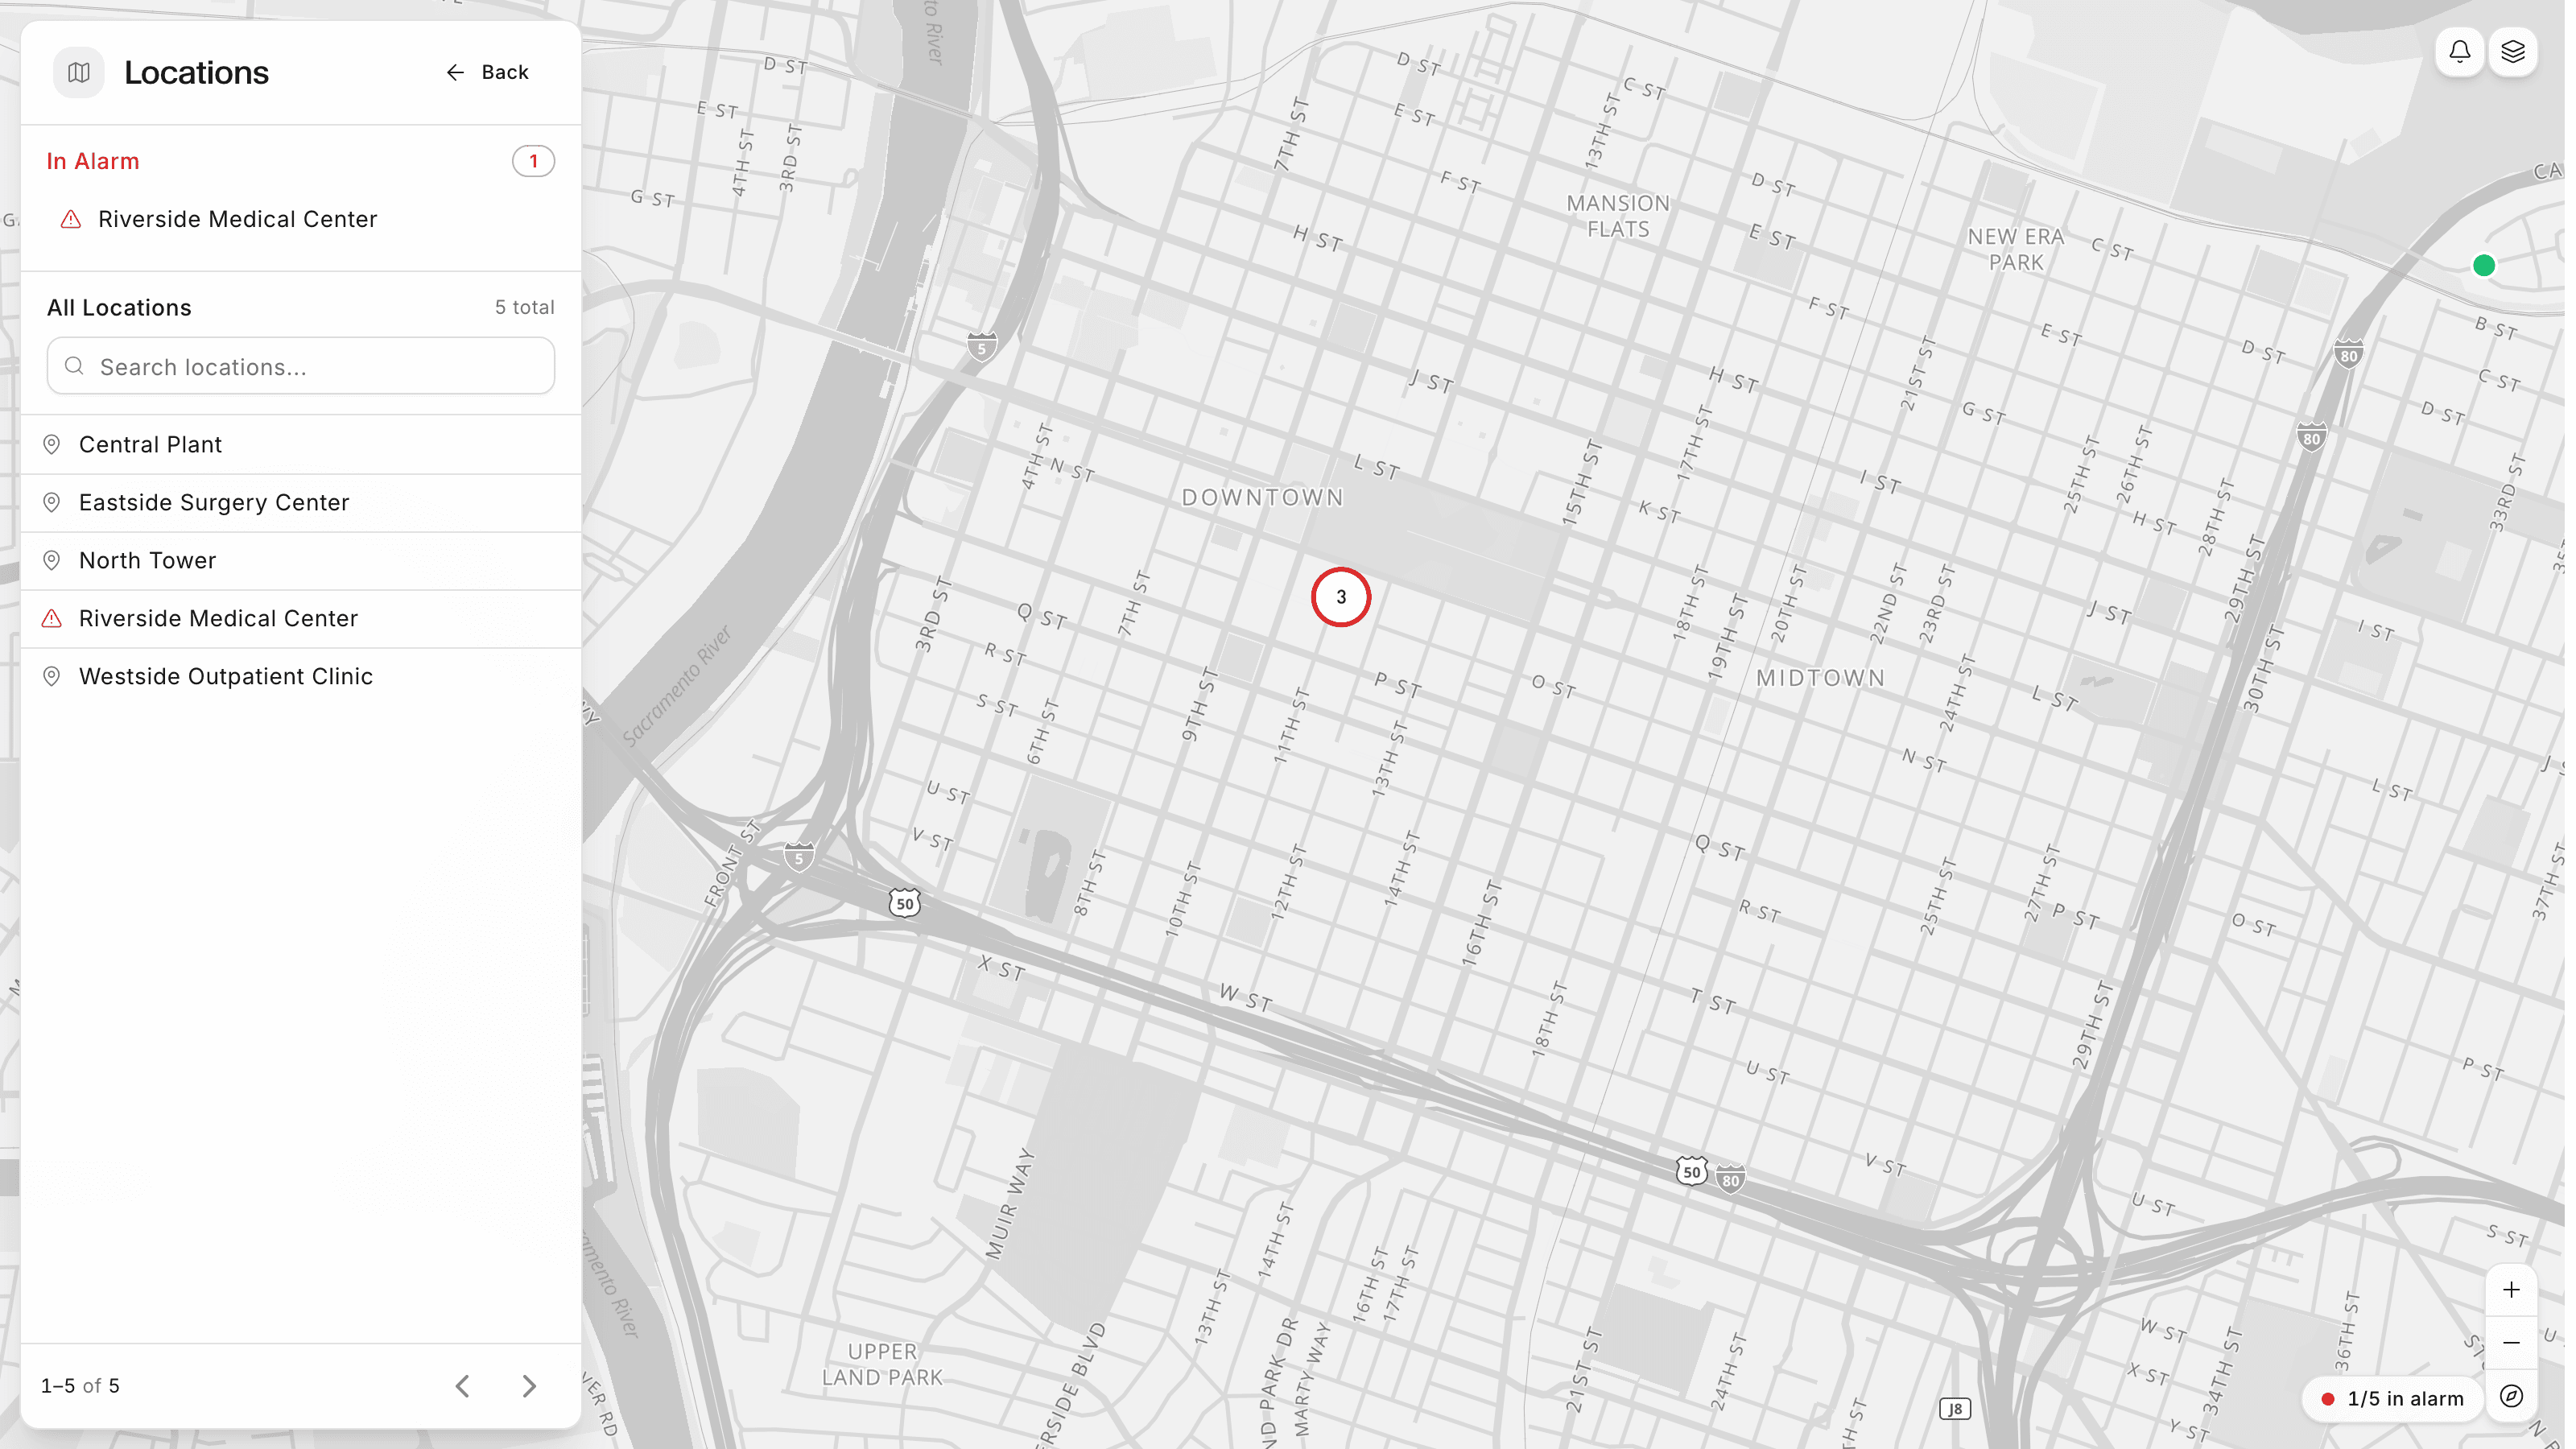
Operators get live dashboards for flow, pressure, levels, and pump status across every station, plus a map view of the whole service area colored by alarm state, with live weather overlays that show which stations are sitting under the storm cell. Alerts route by severity and alarm group to SMS, push, and email, so the on-call operator gets the callout with context instead of a bare autodialer message. Engineers get runtime, start counts, and per-pump trend history through the asset record, which is what makes equipment performance tracking work: compare duty and standby pumps at the same station, watch motor current drift against flow, and schedule the bearing replacement before the failure callout.
The same data runs the energy and compliance programs. Per-station metering and pump efficiency analytics surface off-curve operation and peak-window pumping, the levers behind a typical 15-20% reduction in energy costs. Flow, pressure, and water quality records export as audit-ready PDFs for any date range, replacing the reporting fire drill. Utilities running collection systems and treatment plants extend the same platform through wastewater SCADA, where lift stations, wet wells, and discharge reporting live in the same view.
Remote stations on one map, so a crew is dispatched to the right one.
Connects to existing PLCs, VFDs, and SCADA
Live dashboards for every station and pump
Smart alerts routed to the right responder
Audit-ready data for regulators and leadership
What's in the platform
Features built for water pumping stations
Everything operators, engineers, and compliance teams need to run a modern pumping fleet.
01
Remote monitoring
Every station reporting continuously: flow, pressure, level, pump status, and energy. A map view of the service area shows live status per site with weather overlays, and the edge agent keeps collecting through cellular outages, so the trend history has no gaps.
Per-station energy tracking against flow delivered, with peak-window and tariff-aware scheduling analysis. Customers typically cut pumping energy costs 15-20% by moving runtime out of peak-rate hours and pulling pumps back onto their efficiency curves.
03
Anomaly detection per pump
Runtime, start counts, motor current, and performance drift accumulate per pump. Trend-based anomaly events surface the bearing wearing in, the pump cavitating, and the check valve passing, early enough to schedule the repair instead of answering the callout.
Track water flow rates and pressure in real time across every station in your network. A flow-to-pressure mismatch between stations flags the leak or the failing pump before the loss shows up on the production report.
05
Pump performance analytics
Efficiency per pump, per station, and per fleet, benchmarked over time. Compare duty against standby, this year against last, and the station that struggles against the one that does not, from data the platform is already collecting.
The same platform extends to lift stations and treatment sites: wet-well levels, high-water alarms, pump runtimes, and discharge reporting. See how it works for wastewater operators in our wastewater solution.
Common questions from water utility operators, engineers, and IT teams evaluating ControlCom Connect.
No. ControlCom Connect layers on top of the controls investment you already made. The edge agent reads the PLCs and VFDs at each station over Modbus TCP/RTU, OPC-UA, EtherNet/IP, BACnet, and MQTT, and takes 4-20mA flow meters, pressure transmitters, and level sensors directly, so Allen-Bradley at one station and Schneider at the next land in the same platform. Local control logic stays exactly where it is: the PLC keeps running the station, the floats keep their hardwired backup role, and the platform adds the visibility, alerting, and reporting layer on top. Utilities with an existing SCADA typically run ControlCom Connect alongside it, using it for the mobile access, fleet rollup, and automated reporting the on-prem system was never built to deliver, then decide on the SCADA itself on their own schedule rather than under a procurement deadline.
Most pilot stations are streaming live data within a few days of installing the gateway. The edge agent runs on a small industrial PC at the station, makes outbound-only connections so nothing has to be opened inbound on the utility network, and pre-built protocol connectors pick up the PLC, the VFDs, and the instrumentation without custom driver work. From there, dashboards, alarm thresholds, and escalation paths are configuration rather than development, and a working station view is typically in place within the same week. Fleet rollouts then proceed station by station: the first site establishes the asset template, thresholds, and report formats, and each subsequent station inherits them, so site two through site fifty go faster than site one. Stations with cellular-only backhaul deploy the same way; the agent is designed for intermittent links and buffers data locally through outages.
Three ways, all from data the stations already produce. First, scheduling: pumping into peak-rate hours is the most common waste at booster and well stations, and per-station energy tracking against the tariff windows shows exactly which runtime should move. Second, efficiency: a pump operating off its best efficiency point, because of wear, a throttled valve, or the wrong duty assignment, draws more power per gallon delivered, and flow-versus-energy analytics per pump make the off-curve units visible so VFD setpoints and duty rotation can be corrected. Third, avoiding waste that looks like load: a passing check valve recirculating flow, or a leak downstream, keeps pumps running against work that delivers nothing, and the flow-to-pressure comparison across stations is what catches it. Customers typically see a 15-20% reduction in pumping energy spend once those three levers are visible and worked.
Yes. Flow totals, pressure records, runtime, and water quality readings are logged continuously with full history, and any dashboard exports as an audit-ready PDF for any historical date range, so the numbers the regulator asks for are a date-range query rather than a week of spreadsheet assembly. Scheduled report delivery sends the same package to a distribution list every cycle without anyone remembering to run it, and utilities report saving 10+ hours per month on regulatory documentation. Because every reading is timestamped and kept, the record also answers the harder questions: what the discharge pressure was during the main break, how long the station ran on the night of the complaint, which alarms fired and who acknowledged them. For utilities that also file discharge monitoring reports on the wastewater side, the same reporting engine covers DMR and permit formats on the wastewater SCADA page.
The component at the station is the edge agent, a container that makes outbound-only connections: no inbound ports are opened on the station network, which matters on cellular links where an exposed port is reachable from anywhere. Telemetry is encrypted with TLS 1.3 in transit and AES-256 at rest, and ControlCom holds a SOC 2 Type II report, available under NDA. On the platform side, role-based access controls who can see and acknowledge what, multi-factor authentication and magic-link sign-in are standard, and audit logging records who changed which threshold and when. ControlCom Connect is a hosted service on AWS; the edge agent is the only software you operate at the site, and it is read-focused, so the control layer at the station is not exposed through the platform.
Yes. Lift stations are monitored with the same architecture as booster and well stations, with the points shifted to the collection side: wet-well levels, pump runtimes and start counts, high-water alarms, and intertie status, read from the station PLC over Modbus or OPC-UA. Utilities running both drinking water and wastewater put the whole fleet in one asset hierarchy, so the on-call operator sees every station in the service area on one map regardless of which side of the system it serves, and the same alarm groups and escalation paths cover both. Treatment plants extend further into chemistry trending, chlorine residual, and discharge permit reporting, which is covered in depth on the wastewater SCADA page. The practical benefit of one platform across both is one on-call workflow, one reporting engine, and one set of operator knowledge instead of two.
Get started
Ready to transform your water pumping operations?
Pick one booster station or lift station. We install the edge agent, connect the PLC, VFDs, and instrumentation already there, and configure the dashboards, alarms, and reports your operators need. You evaluate the platform on real station data before rolling out to the fleet.