Explore
Data exploration
Slice live and historical readings with multi-dimensional filtering, correlation, and trend analysis, without exporting a single spreadsheet.
Filter, correlate, and report on operational data across all your connected equipment, with the audit trails compliance demands.
Slice live and historical readings with multi-dimensional filtering, correlation, and trend analysis, without exporting a single spreadsheet.
Build the reports your team actually needs, schedule them automatically, and deliver them by email in the format each stakeholder expects.
Keep audit trails and regulatory templates ready for JCAHO, EPA, and other standards, so the records you have to keep are always one click away.
Dig into the data, hand stakeholders the reports they need, and get an event the moment a reading stops behaving like its own history.
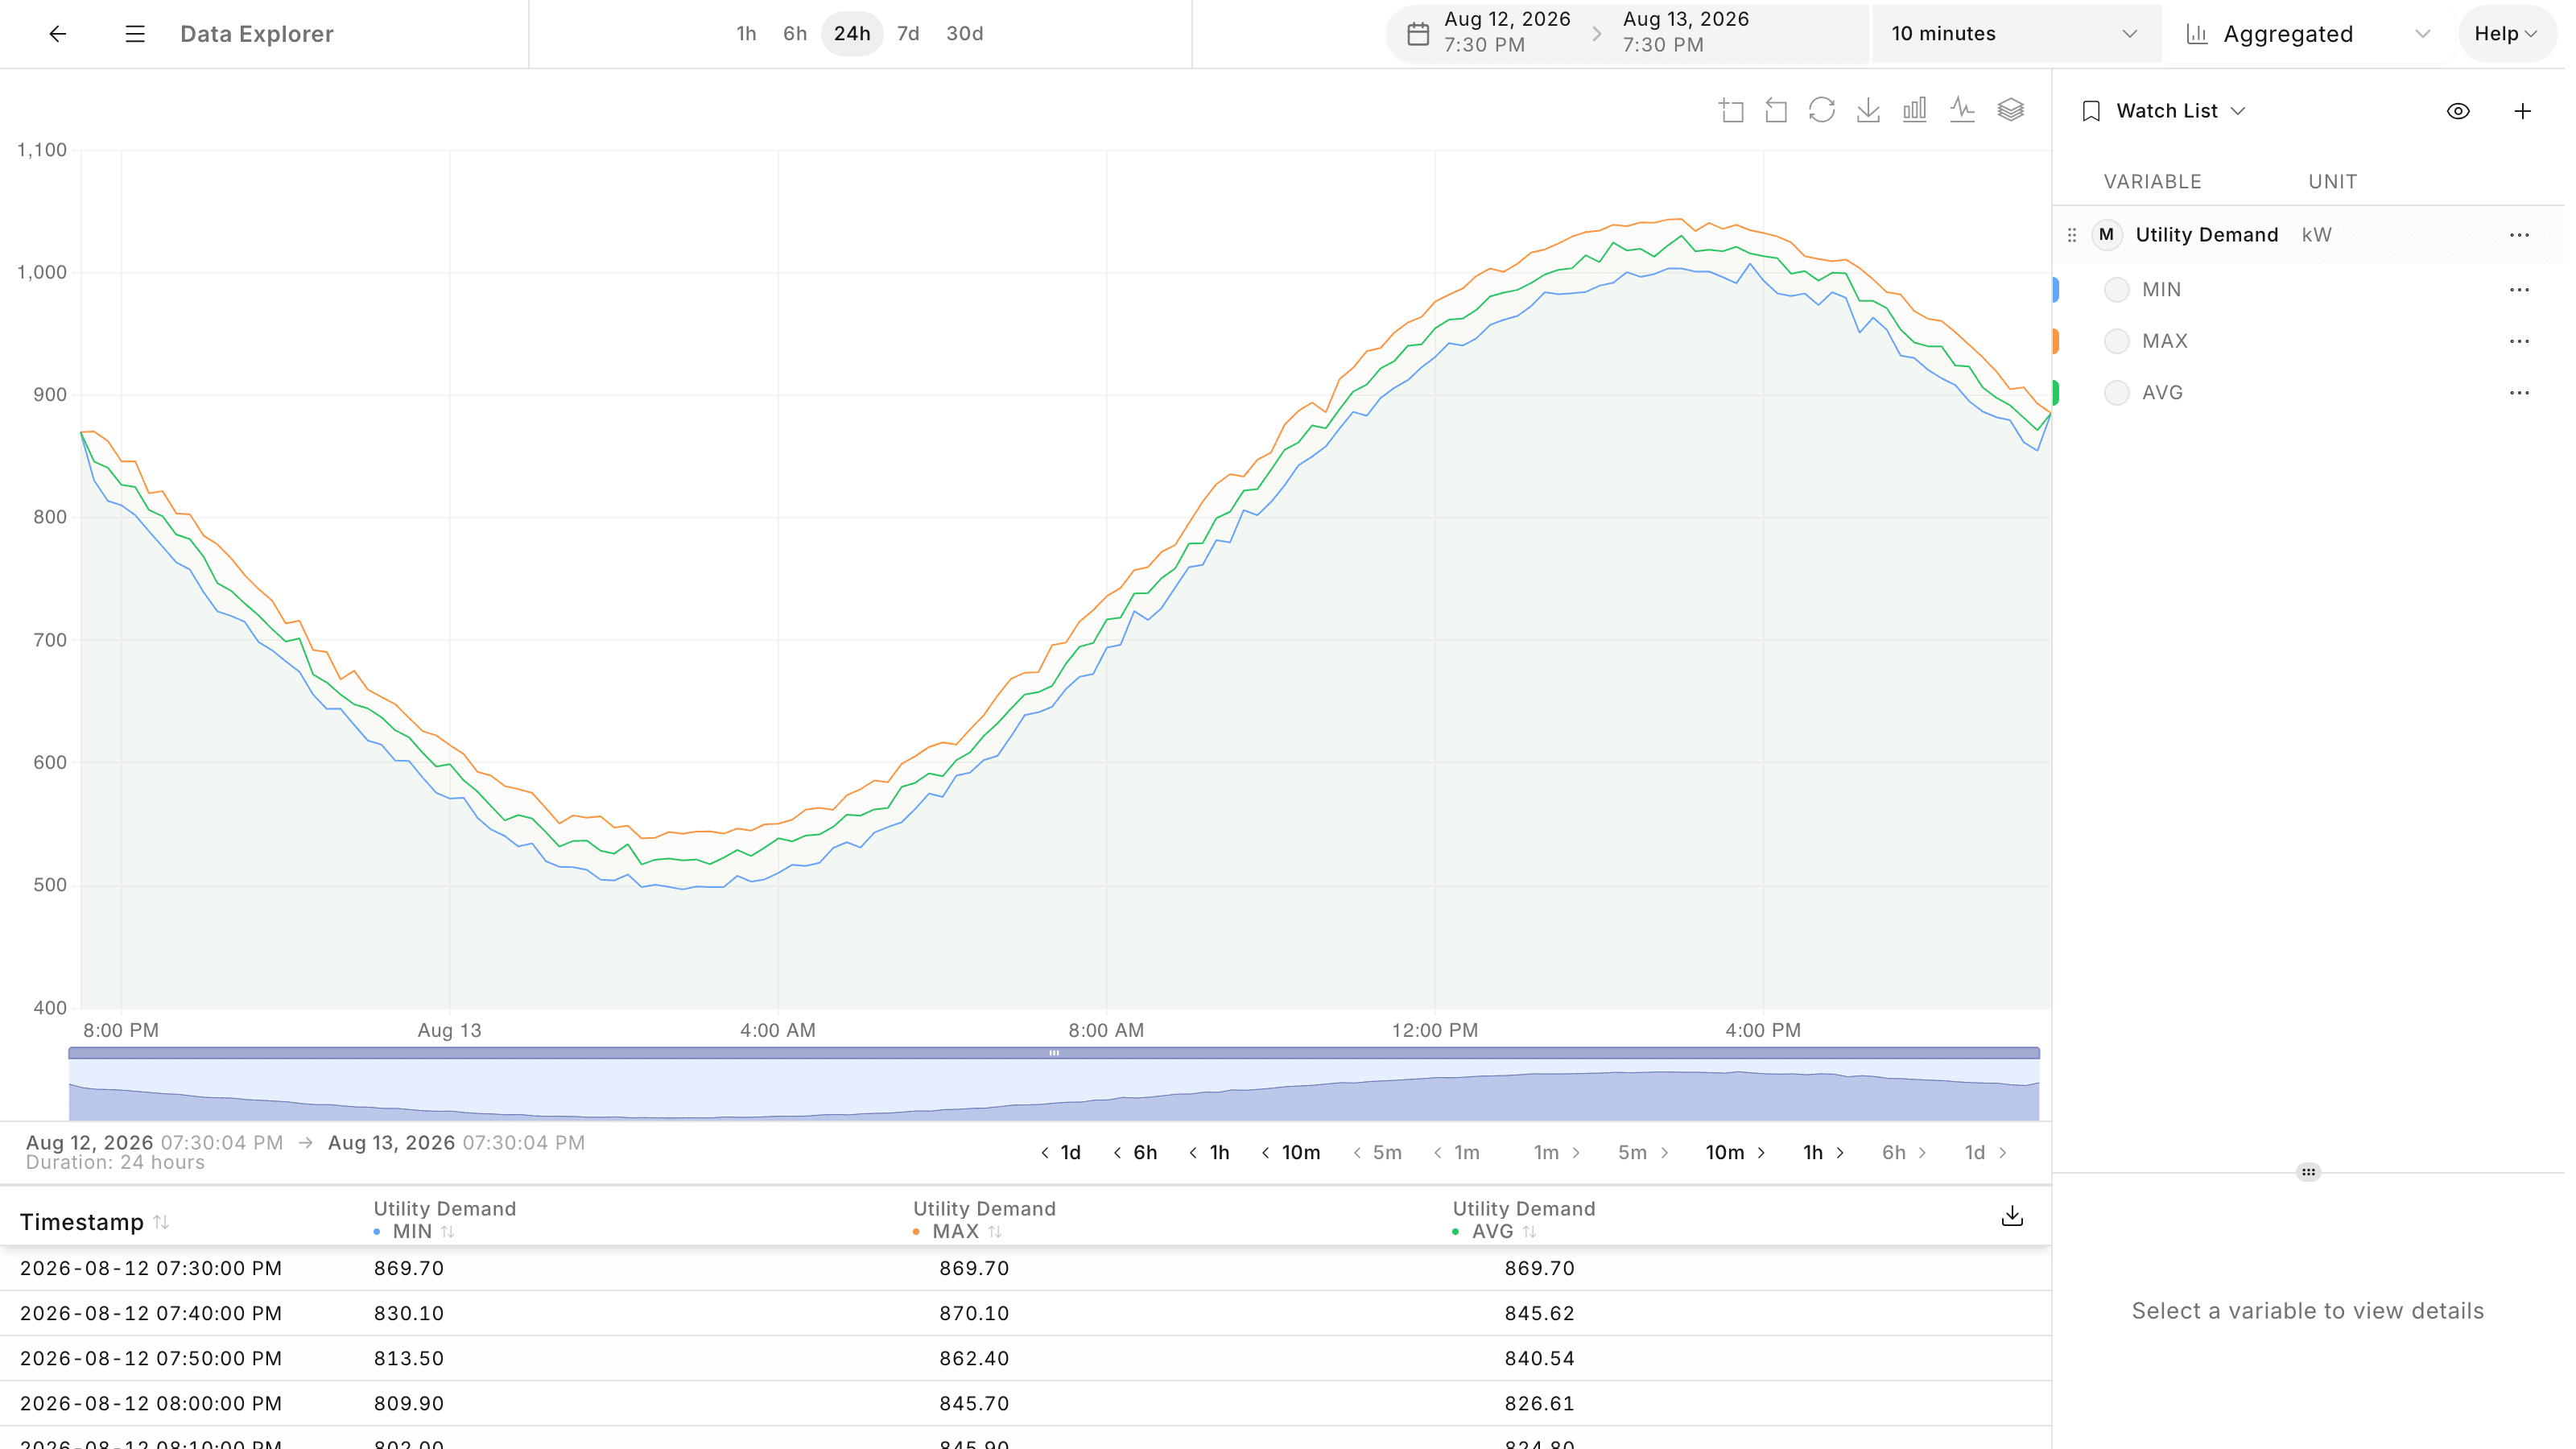
Filter across dimensions, correlate signals, and trend live against historical data so patterns surface where the data already lives. Aggregated mode summarizes each variable per time bucket; raw mode shows readings exactly as the device sent them, for troubleshooting. Once you know which variables matter, the Graph widget puts them on a dashboard for the whole team.
Build custom report templates, schedule them to run automatically, and deliver them by email in the formats each stakeholder expects.
Anomaly detection learns each variable's baseline from its own history and raises an event when a reading drifts out of range, a sensor sticks flat, or data stops arriving, no thresholds to write. Findings on the same asset group into incidents, and every event opens in the Explorer pre-framed around the episode, for teams working on equipment performance. Audit trails and regulatory templates keep every facility ready for inspection.
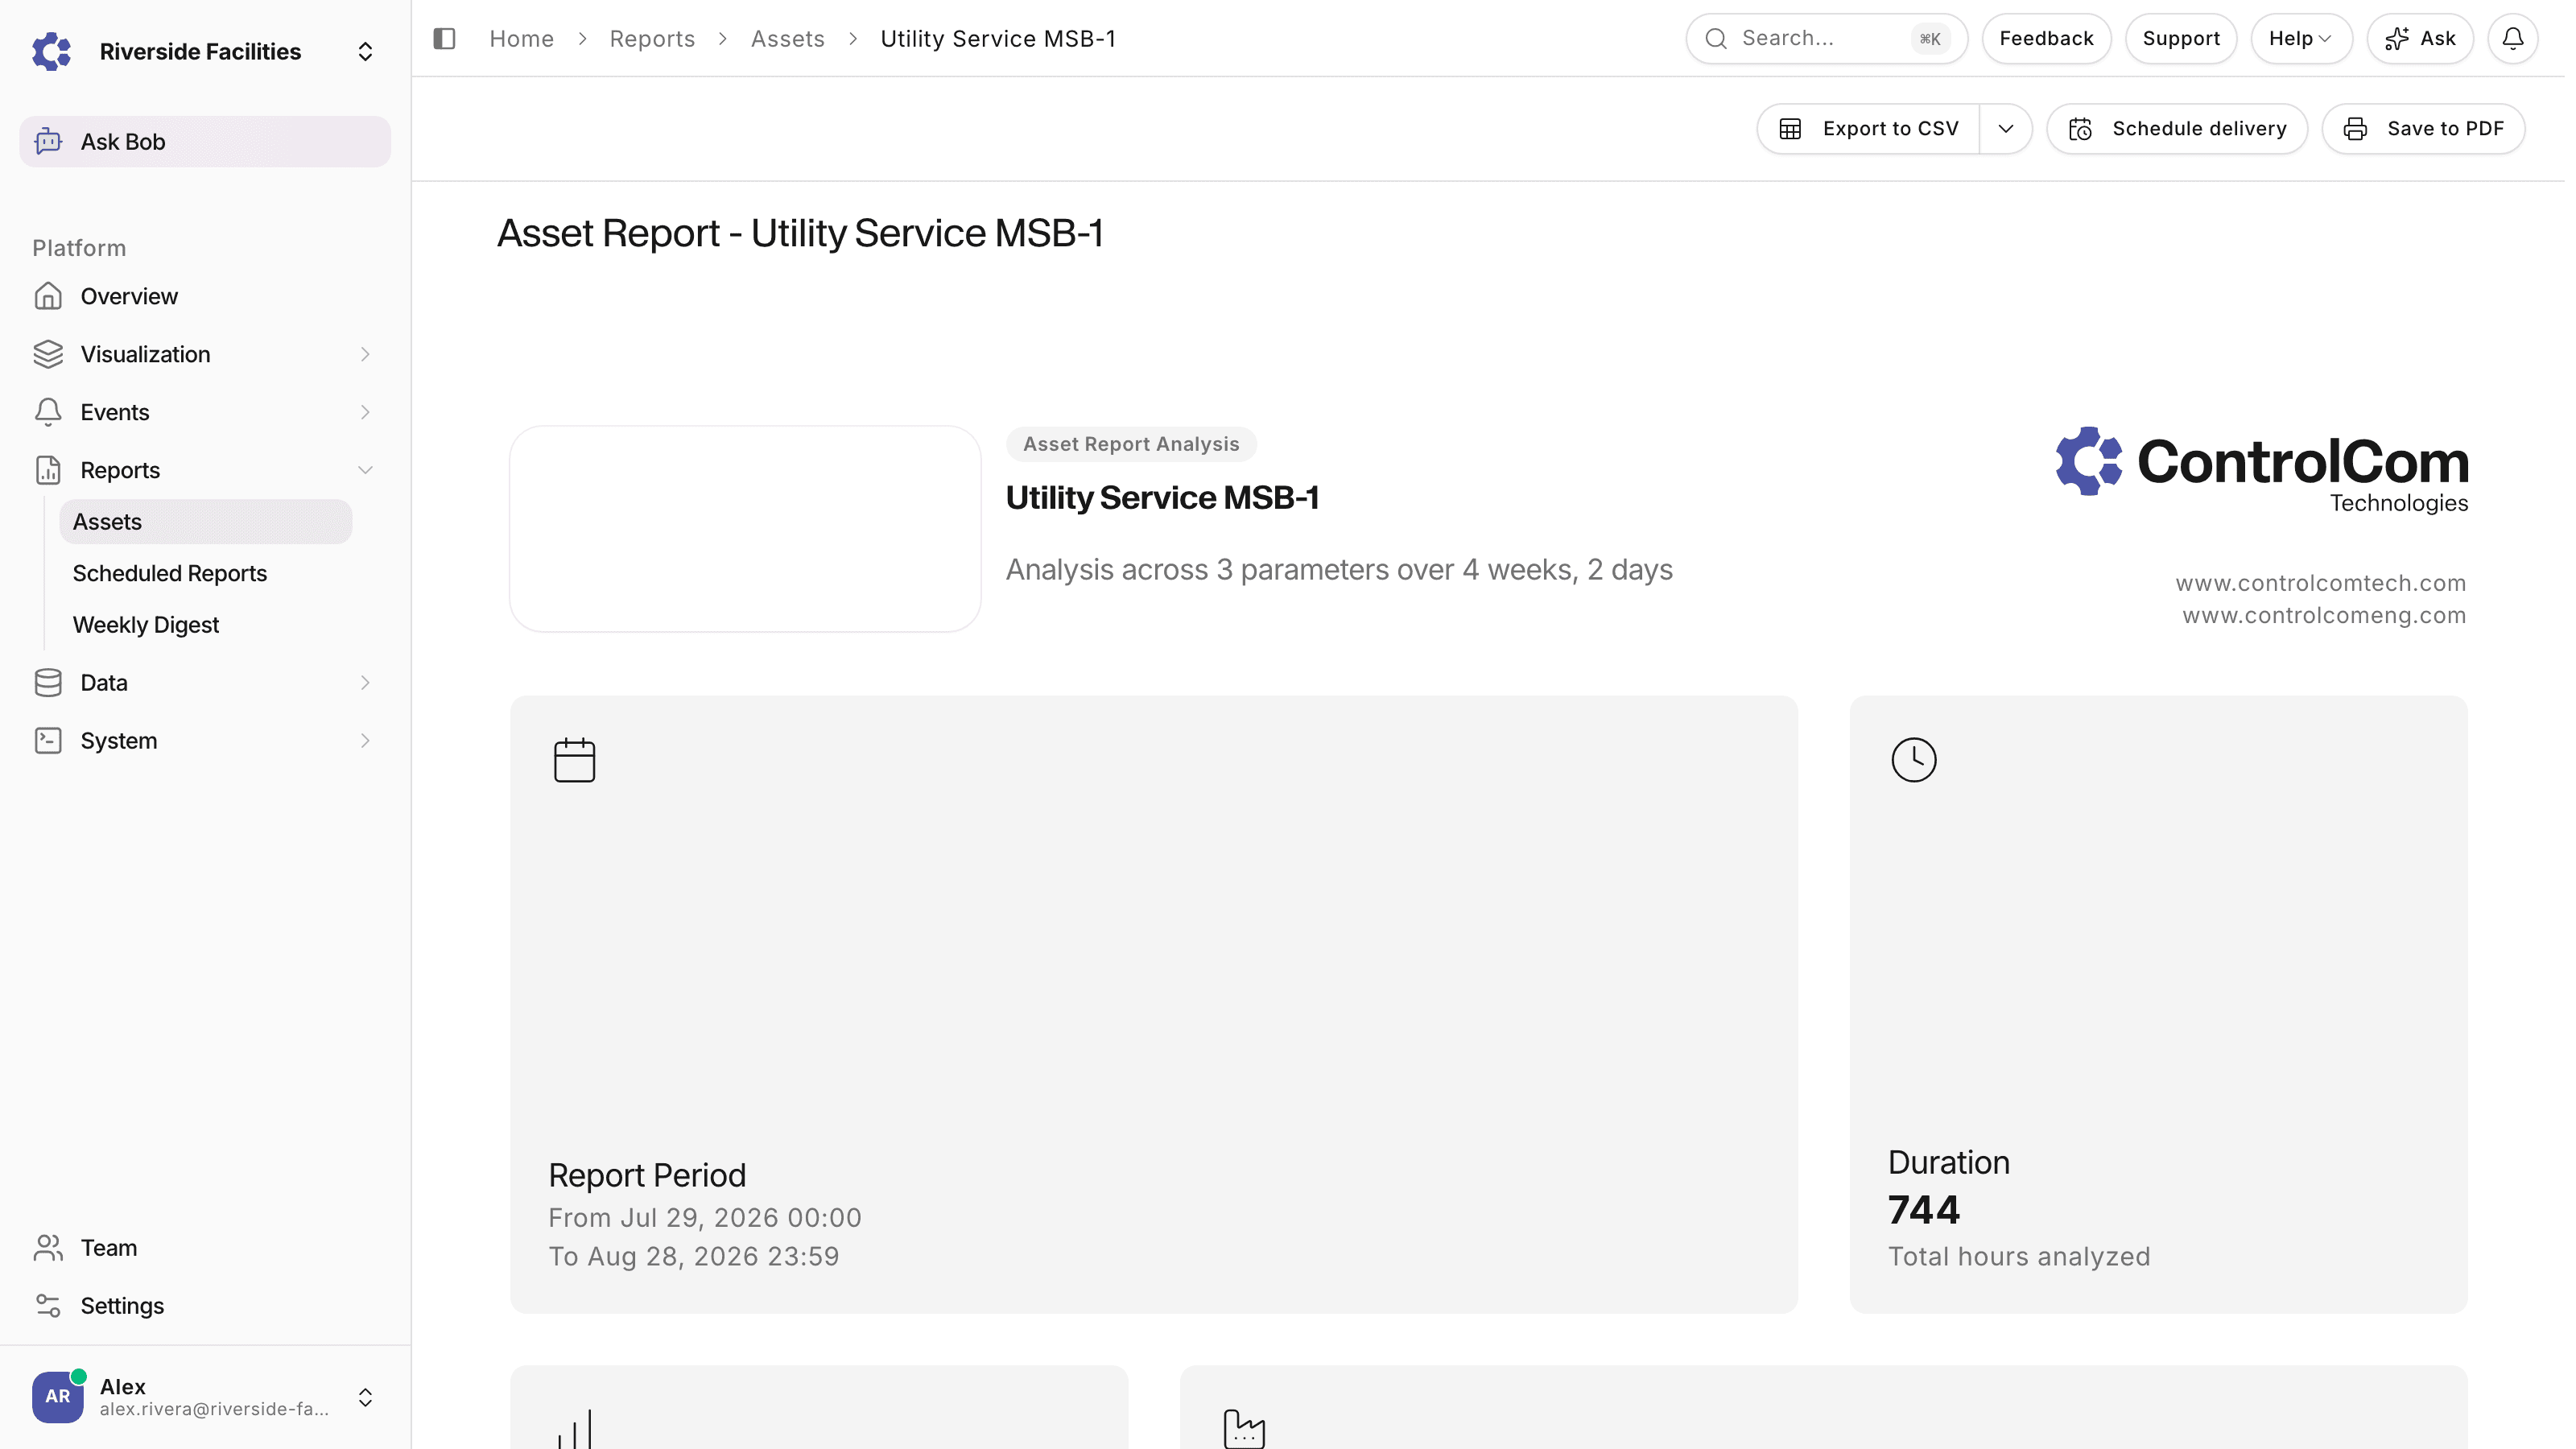
Reports are generated against assets rather than raw devices, so a generator or a service entrance reports as the piece of equipment it is.
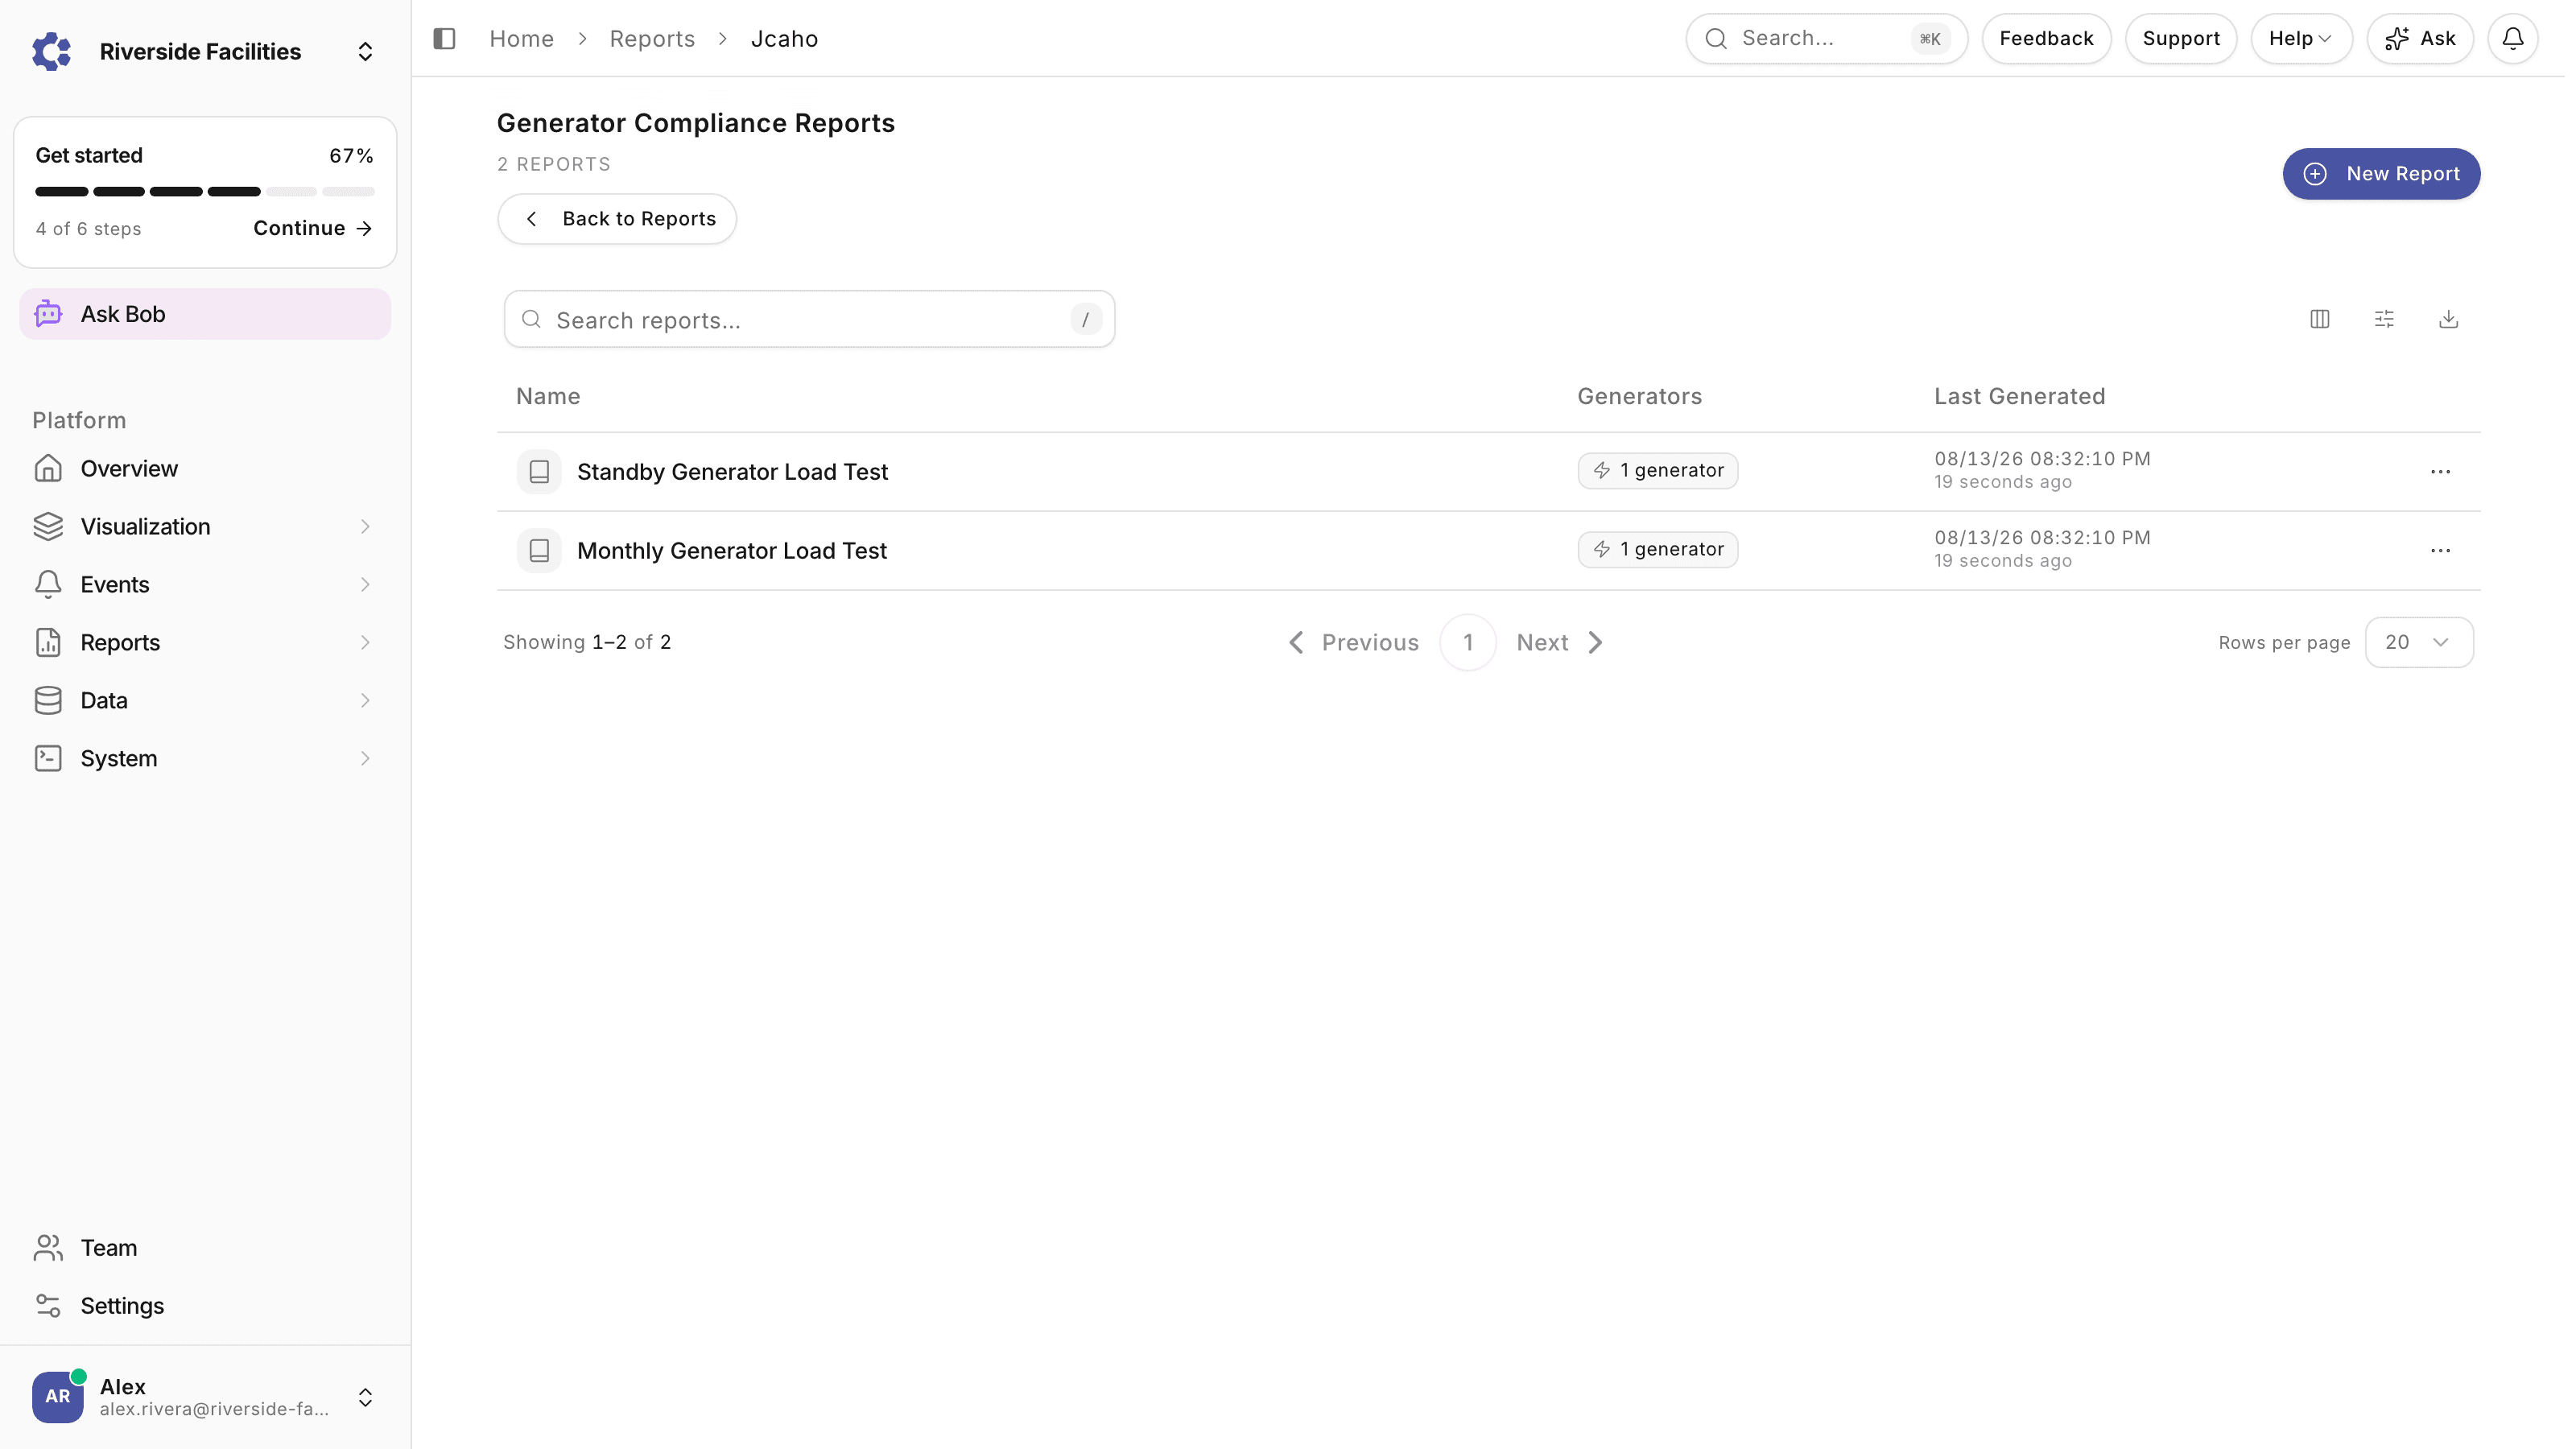
Generator compliance reports record each load test against Joint Commission requirements, pass or incomplete, and generator runtime reports list every run split into emergency and non-emergency hours for EPA reporting. The same records serve any facility that runs standby generation, from hospitals to data centers. Each report carries a Report Configuration card, so the document stands on its own at audit time.
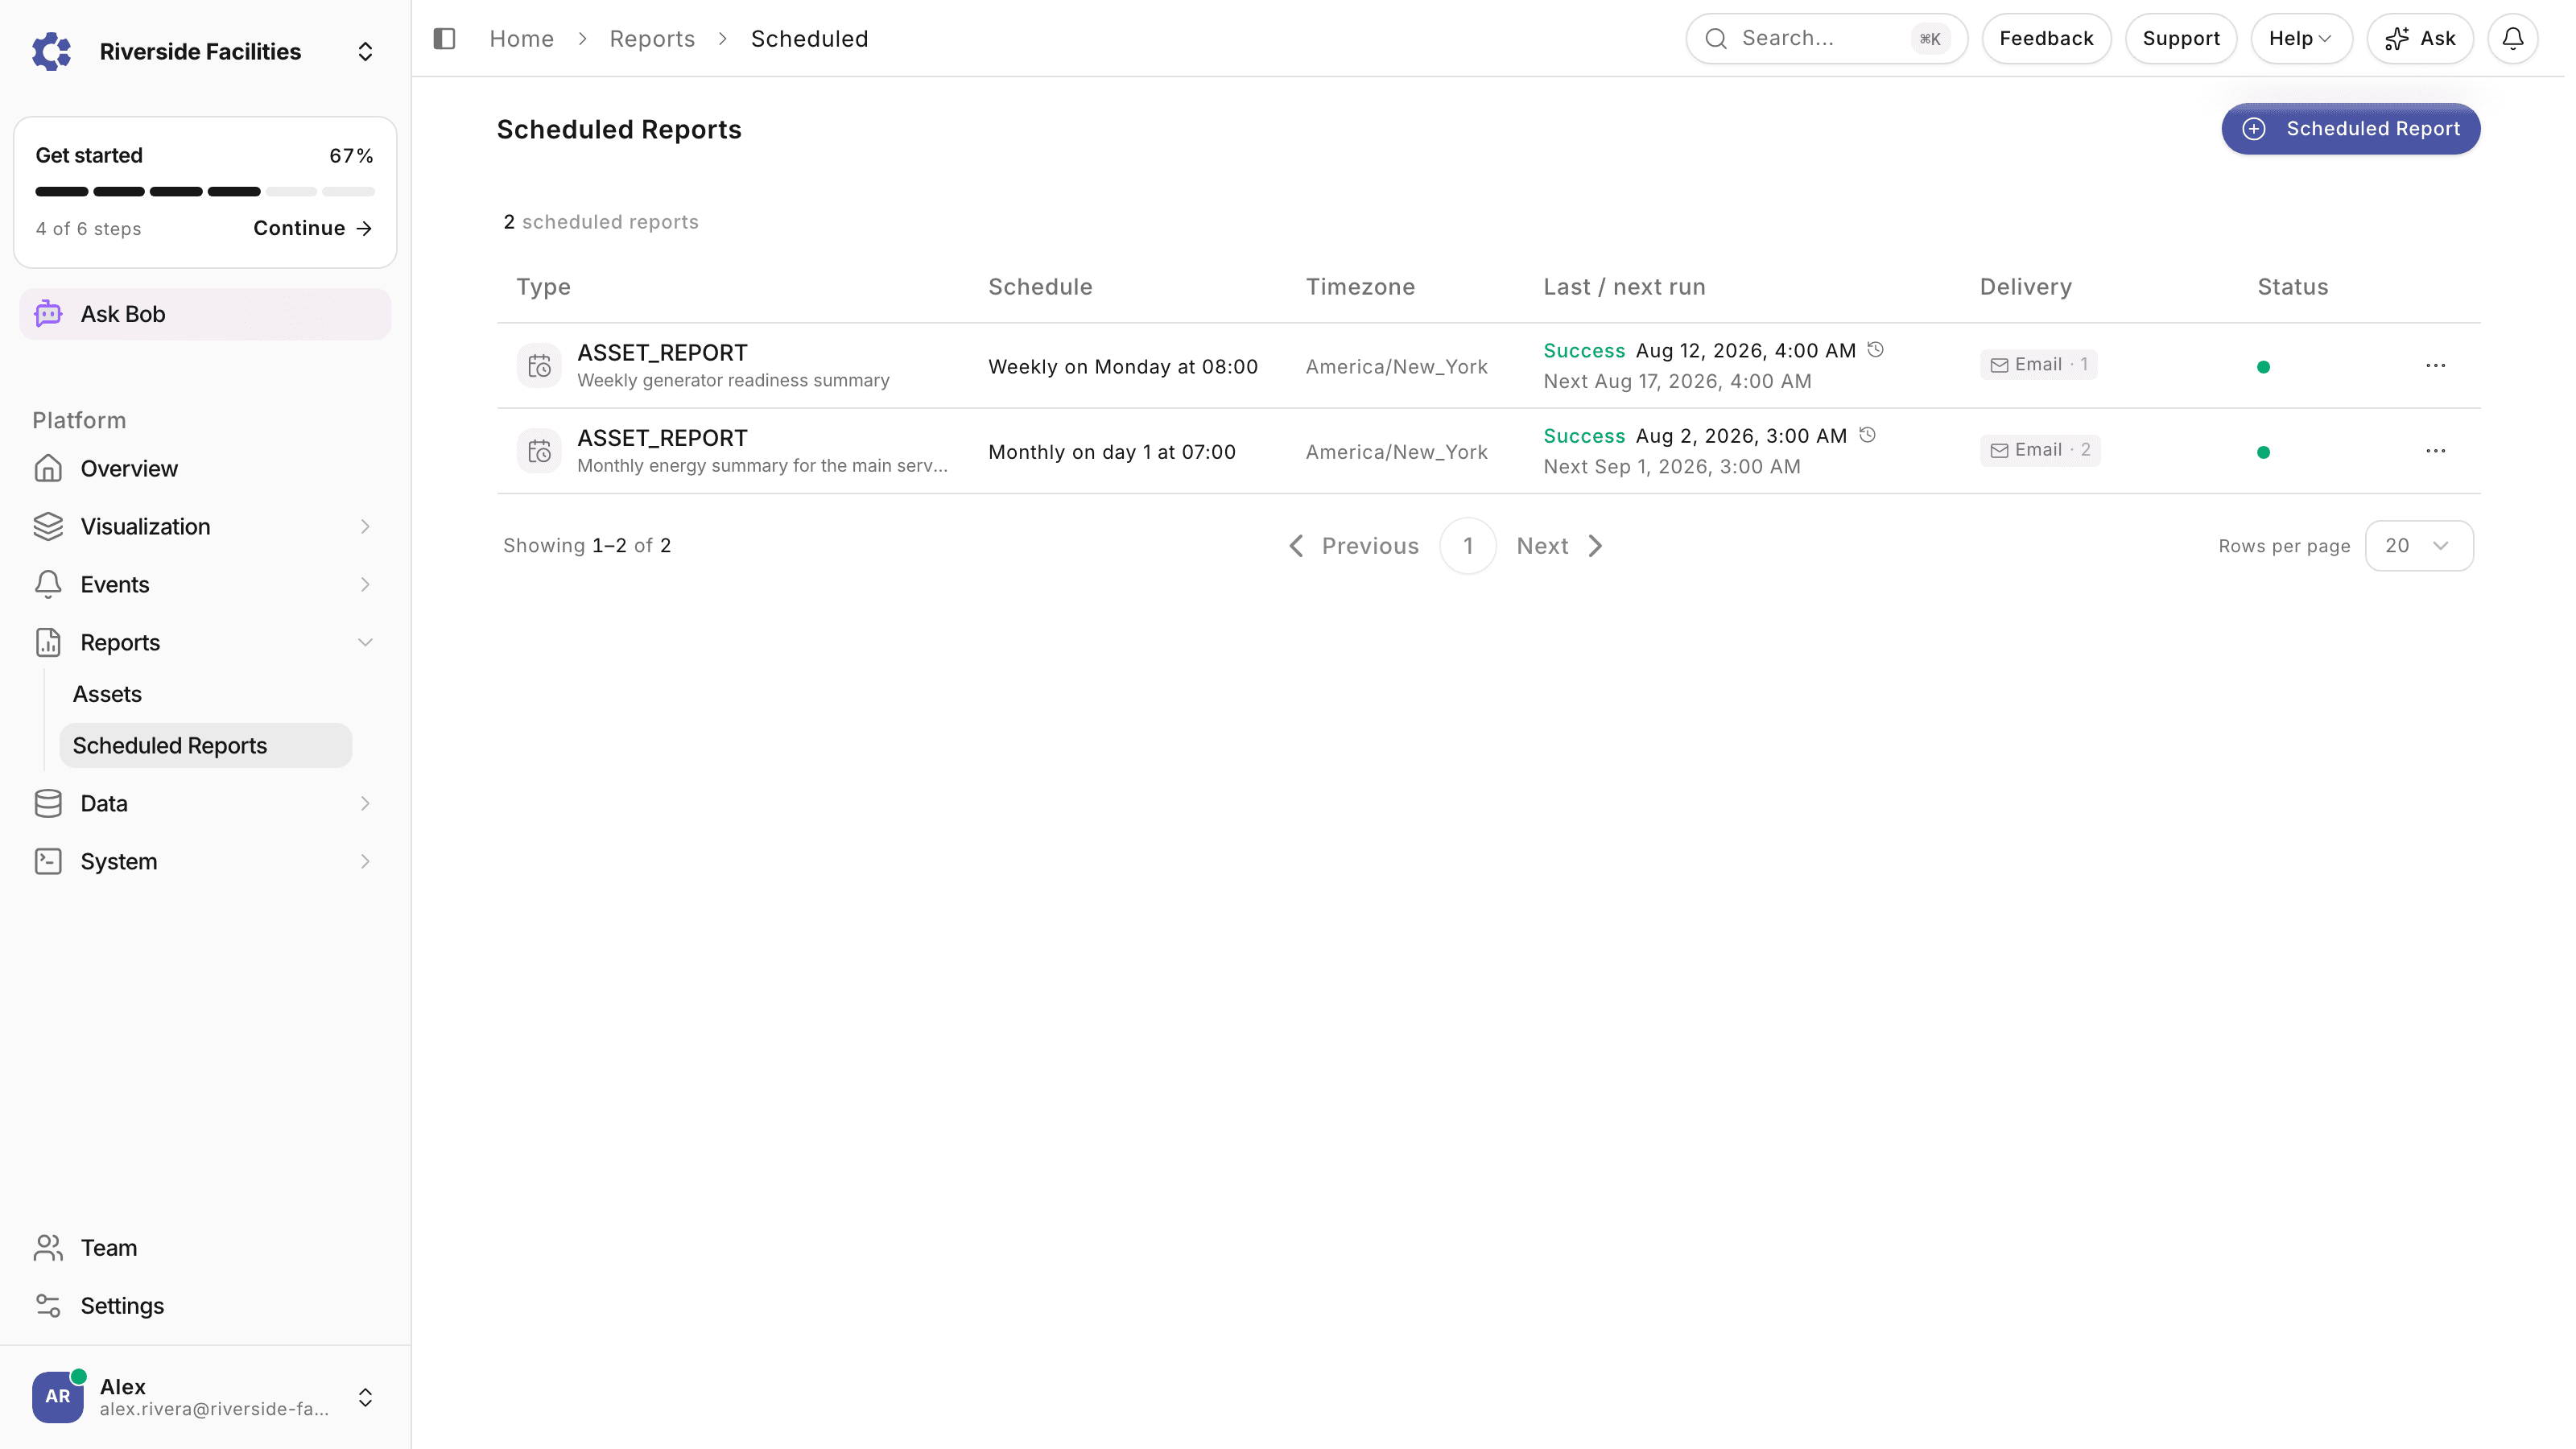
A scheduled report runs hourly, daily, weekly, or monthly over a rolling window that is resolved fresh on every run, and emails the PDF to recipients picked from your organization or typed in. On the energy side, load factor analysis reads utility accounts and bills and reports peak demand and energy use per utility company, feeding the work of teams focused on energy usage.
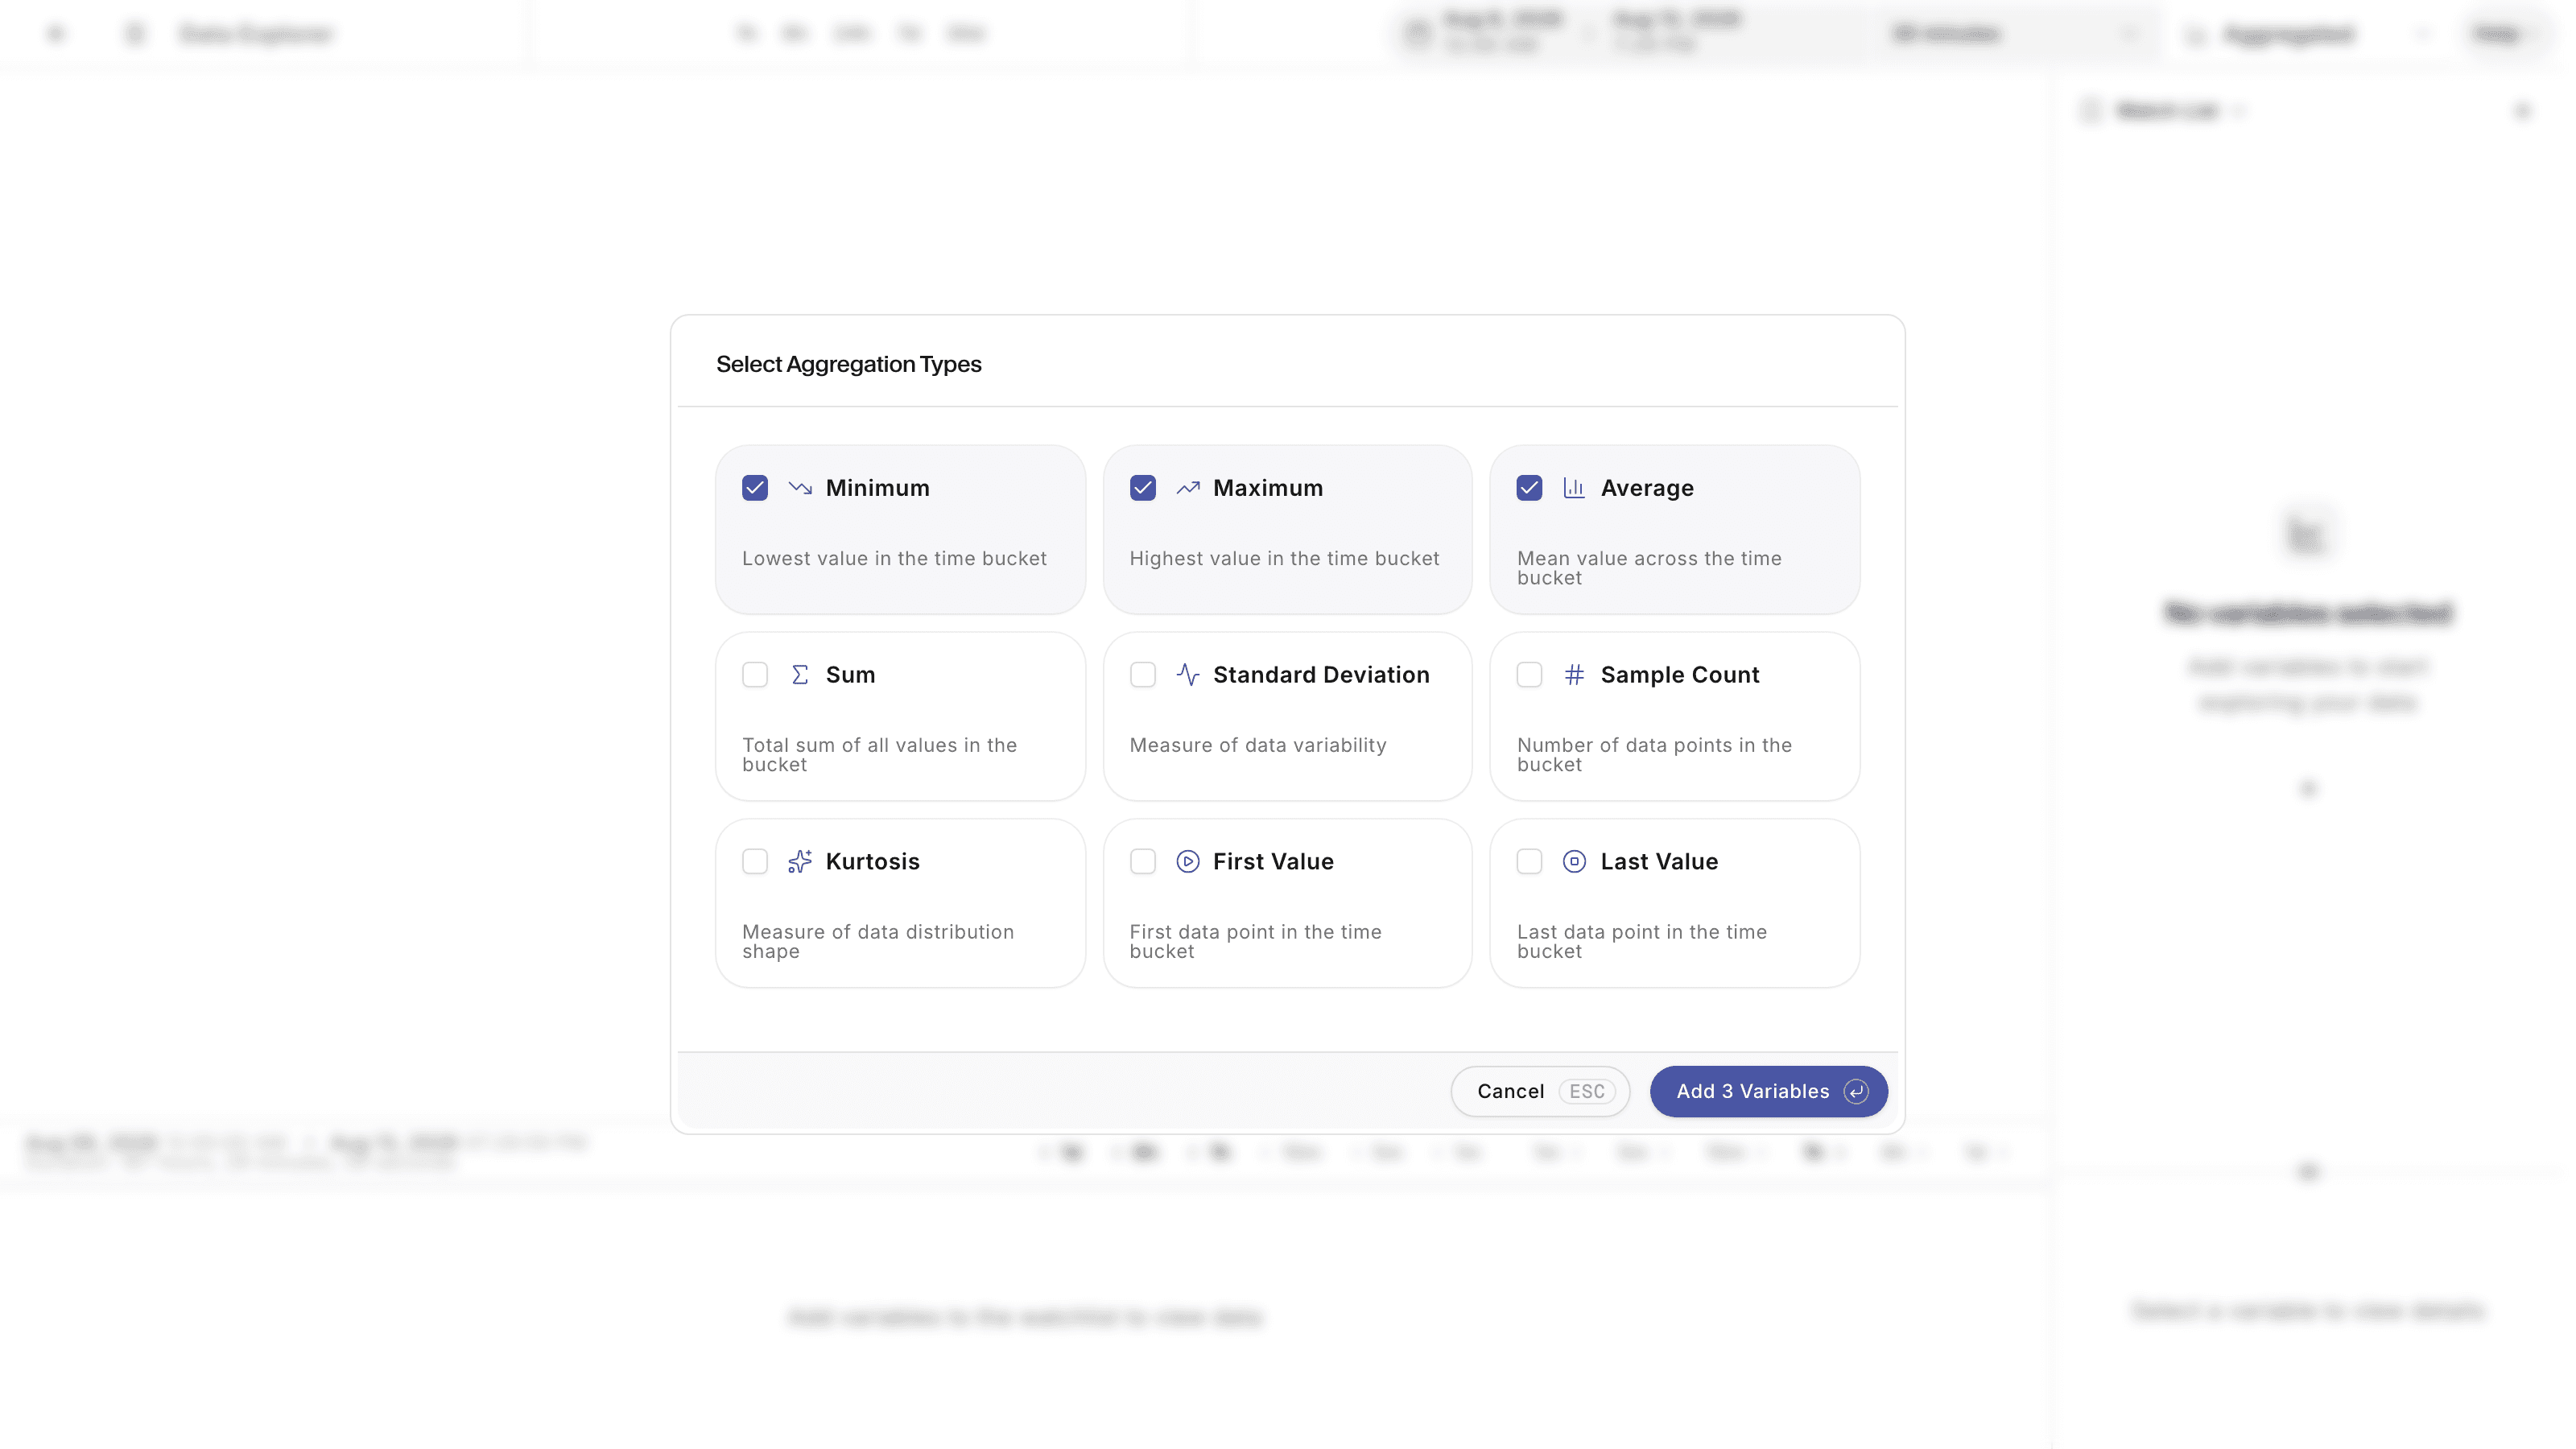
The Data Explorer is the platform's tool for digging into stored time-series data. It plots readings from any number of variables in aggregated mode, where each point summarizes a time bucket from 5 seconds up to a year using minimum, maximum, average, sum, standard deviation, sample count, or first and last value, or in raw mode, which shows readings exactly as the device sent them, nothing smoothed away. Time jump buttons step through an incident minute by minute, and alarm thresholds can be overlaid on any plotted variable. The whole state of the view is encoded in the page URL, so a colleague opens exactly what you were looking at from a pasted link. Watch lists and saved configurations preserve the setups your team returns to, and the table exports to CSV at full precision.
Nobody sets a threshold: the baseline is learned from data already stored. Each numeric variable is compared against its own previous fourteen days of hourly readings, hour band by hour band, so a value at 3am is judged against other nights, not the working day. Three detectors run over the same data. Out of range reports how far the latest value sits from its baseline, as a z-score. Stuck sensor flags a value that has stopped moving while its history says it should be moving. Data gap reports readings that stopped arriving, after three consecutive missing hours. Related findings on one asset group into a single incident, and when a related asset picks up the load within hours, the incident is upgraded to a load switchover naming the asset that picked the load up.
Generator compliance reports record each generator load test against Joint Commission requirements, pass or incomplete. Generator runtime reports list every run split into emergency and non-emergency hours, the split EPA reporting asks for. Asset data reports trend the variables of any piece of equipment over a chosen period and include a Report Configuration card recording exactly what was requested, a Data Insights section flagging variability, outliers, trends, and data quality concerns, and optional weather correlation for the asset's location. Every report generates from the same stored readings the rest of the platform uses, so nothing is re-entered by hand, and each saves to PDF or exports to CSV, flat or pivoted. A weekly digest rounds up alarm activity, and load factor analysis reports peak demand and energy use per utility company.
Yes. A scheduled report runs on its own and emails the result as a PDF. The setup is three steps. Report describes what the run covers: the asset, its variables, and a rolling reporting window such as the last 30 days that is resolved fresh on every run. Schedule sets the frequency, hourly, daily, weekly, or monthly, with the hour and day the frequency needs. Delivery collects the recipients, picked from your organization or typed as any address. The list shows every scheduled report with its schedule in plain words, its last result and next run time, and its delivery method, with run history behind each entry. Preview report opens the document as it would generate right now, verifying a schedule before it emails anyone. Permissions separate reading the schedule from changing it.
Start turning operational data into competitive advantage in a 30-minute demo with engineers who have actually run the plant.
Sizing it up?See plans and allotments.