Build
Drag & drop builder
Assemble dashboards from 50+ pre-built widgets with custom layouts and responsive design, then save and share them as templates.
Operational dashboards built for industrial environments, with the widgets, live data, and cross-site views your team relies on.
Assemble dashboards from 50+ pre-built widgets with custom layouts and responsive design, then save and share them as templates.
Readings stream in sub-second with historical trend overlays, auto-scaling charts, and alerts that fire the moment a threshold breaks.
Trend the same metric across every facility side by side, with normalized comparisons and benchmarking across regions.
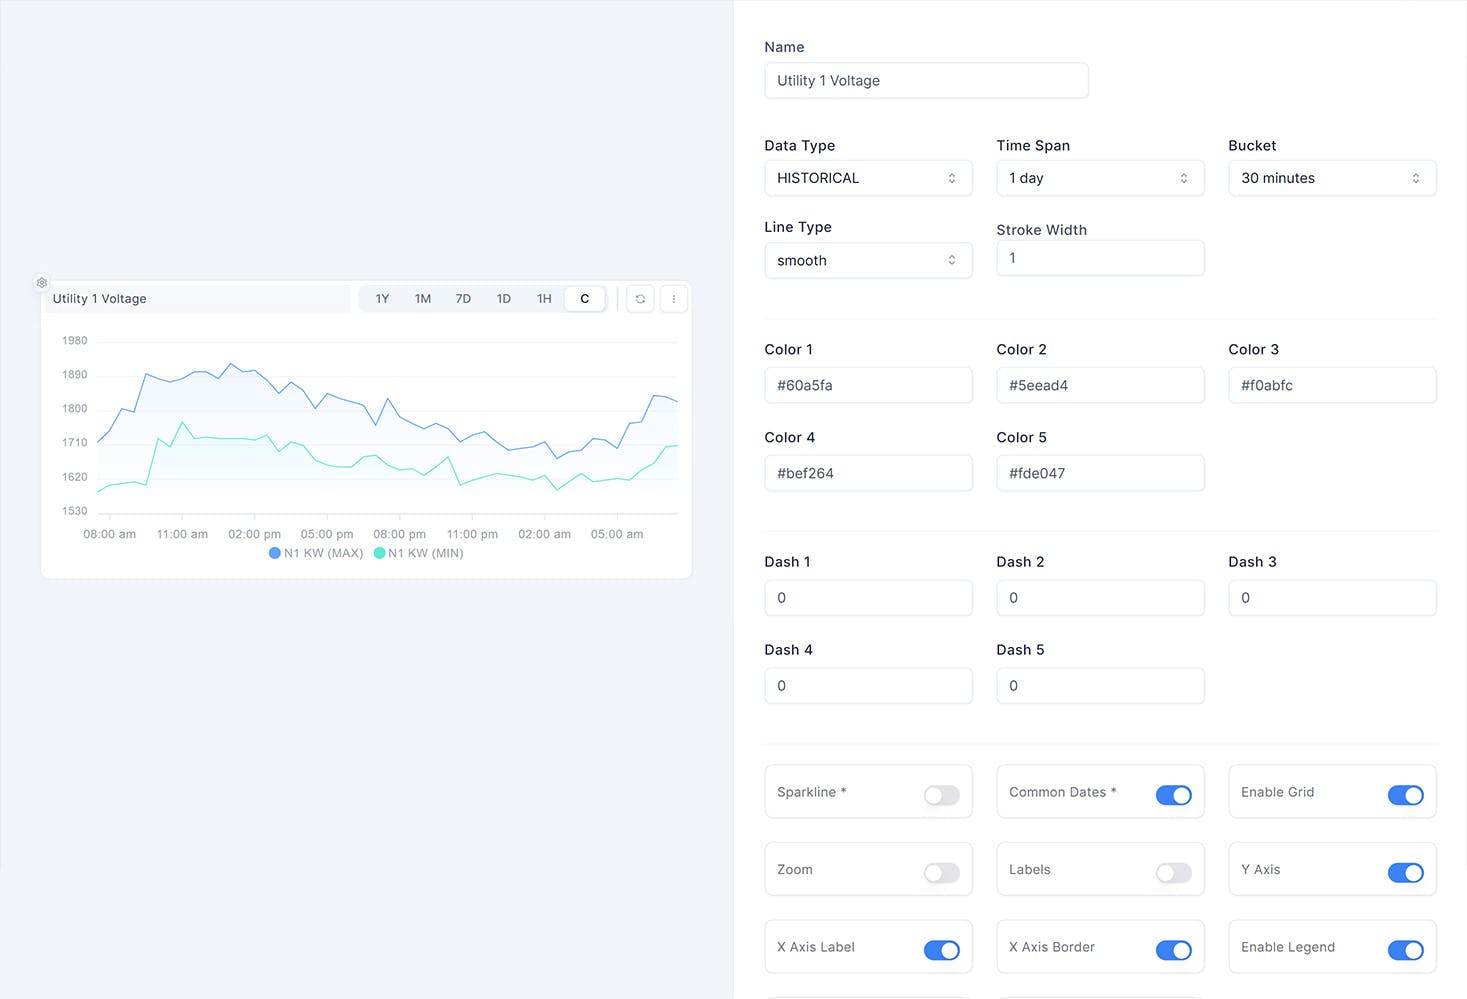
Compose the view your team needs, watch it update live, and tailor every widget without touching code.
Drag widgets onto a responsive canvas, arrange them for the way your team works, and save the result as a reusable template.

Pick from 30+ chart types, set custom color schemes, and add interactive controls so each panel answers a real operational question.
Readings stream in sub-second with historical overlays and auto-scaling charts, so a threshold breach surfaces as an alert instead of a surprise.

See ControlCom Connect dashboards against your own equipment in a 30-minute demo with engineers who have actually run the plant.