Condition
Asset condition monitoring
Track condition and performance on every asset from the readings it already reports (temperature, pressure, runtime, load), with alarms and anomaly events that surface trouble early.
Monitoring and management of industrial assets, with alarms and anomaly detection that surface trouble before it spreads.
Track condition and performance on every asset from the readings it already reports (temperature, pressure, runtime, load), with alarms and anomaly events that surface trouble early.
Plan service windows around real condition data, runtime hours, and alarm history instead of a fixed calendar, and cut both downtime and maintenance cost.
Organize assets by site, line, or system with geographic mapping and a clear hierarchy, then trend performance per location.
Watch condition in real time, act on the first sign of trouble, and keep every site organized as your asset base grows. Teams chasing equipment performance targets start here.
Track temperature, pressure, runtime, and performance trends on each asset, with alarms and anomaly events that turn raw readings into a clear signal of what needs attention.
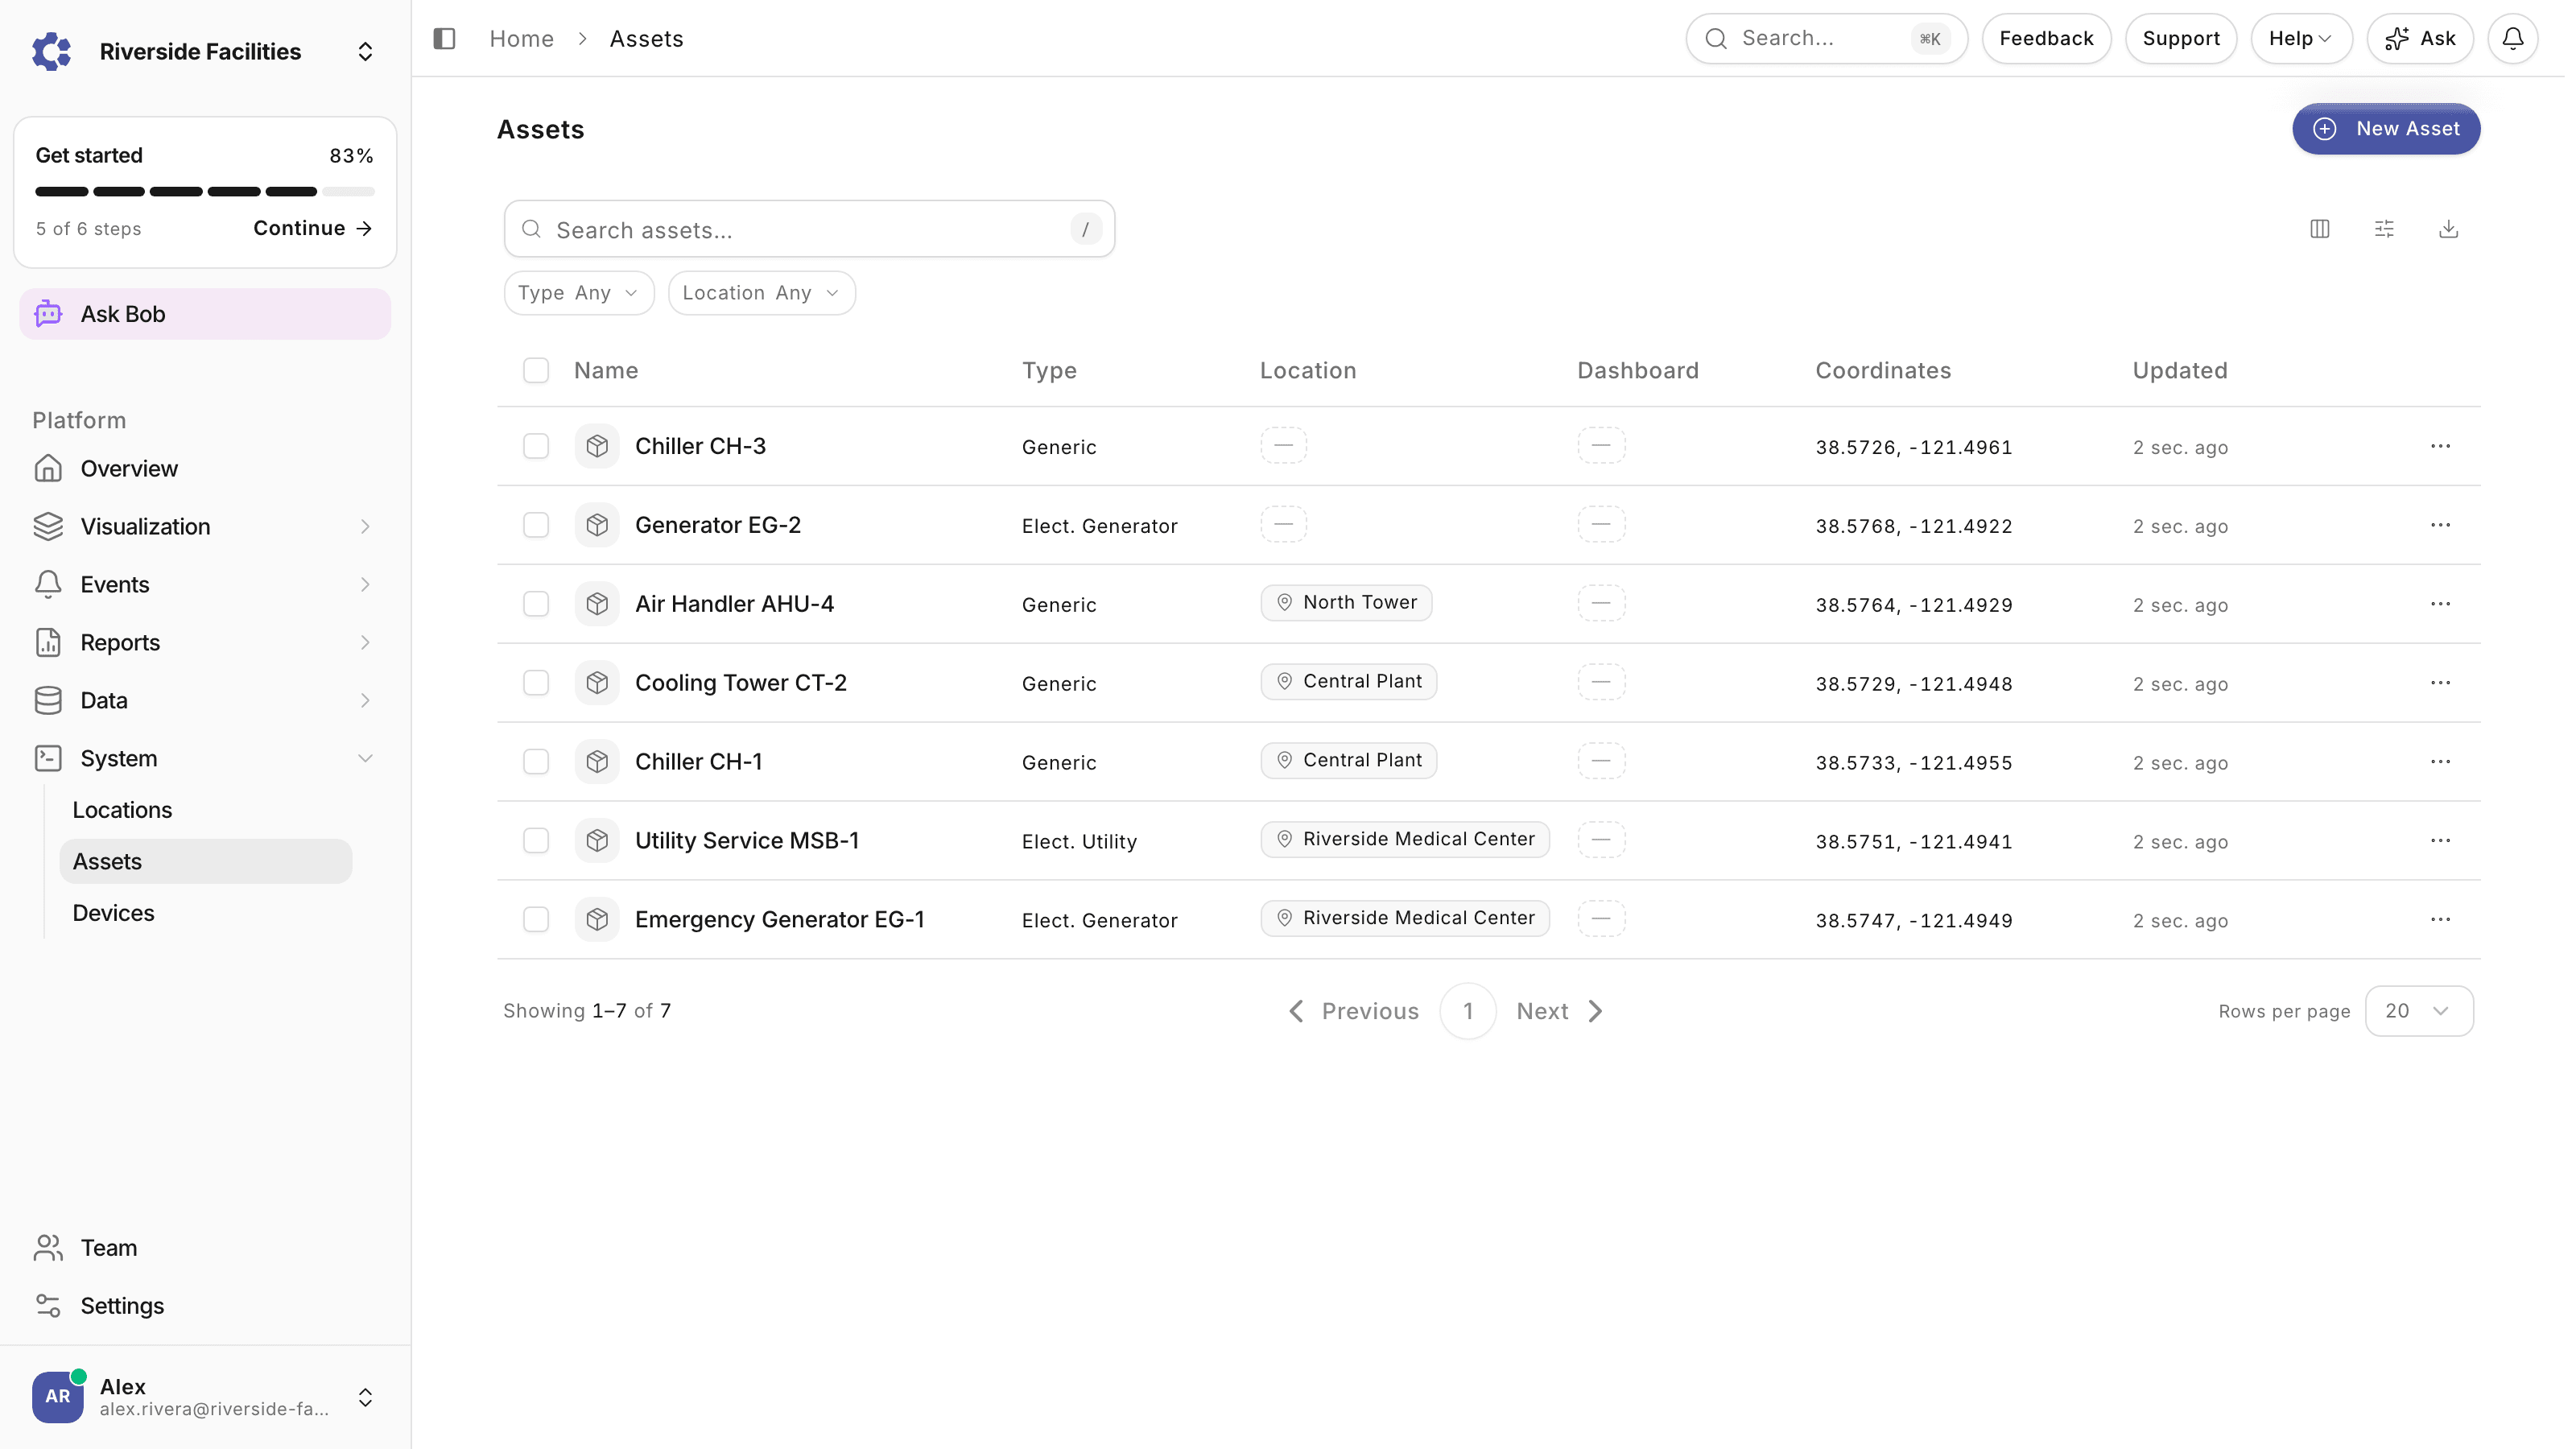
Alarms fire the moment a reading crosses a limit, and anomaly detection catches drift no rule anticipated, so service windows are planned around what the equipment is doing rather than a fixed calendar.
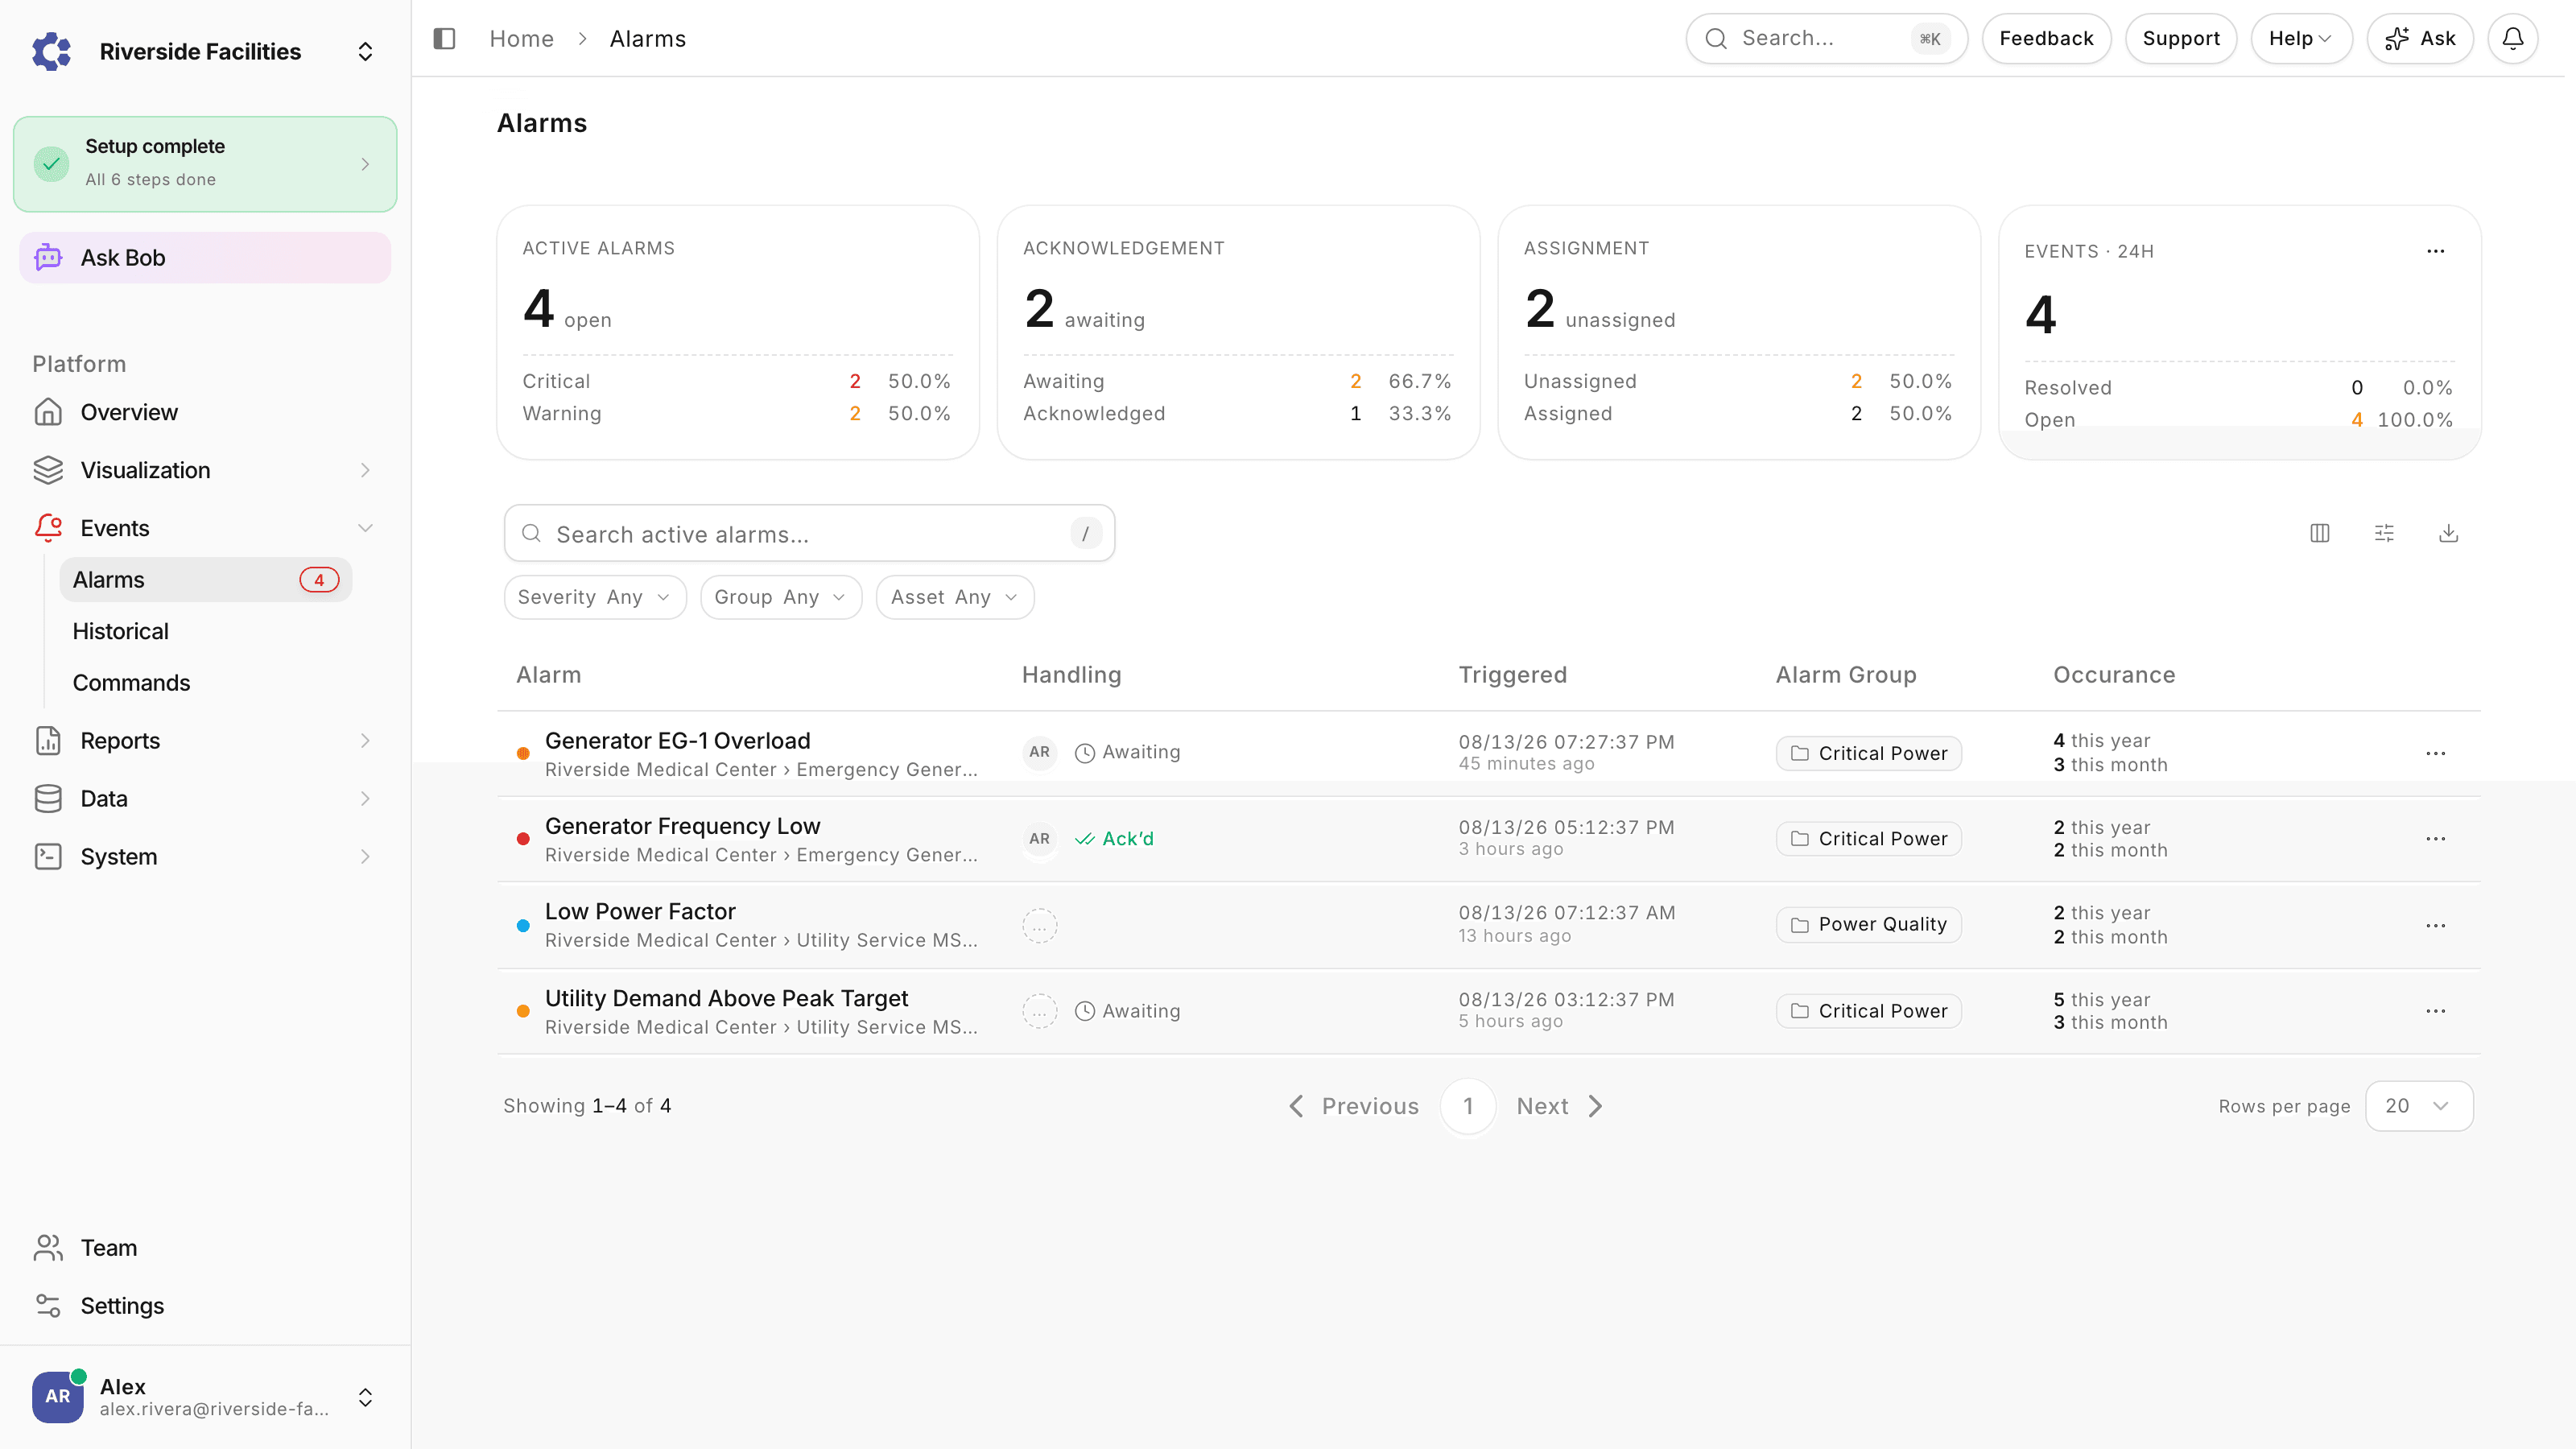
Group assets by site, line, or system with geographic mapping and a clear hierarchy, then trend efficiency and OEE per location.
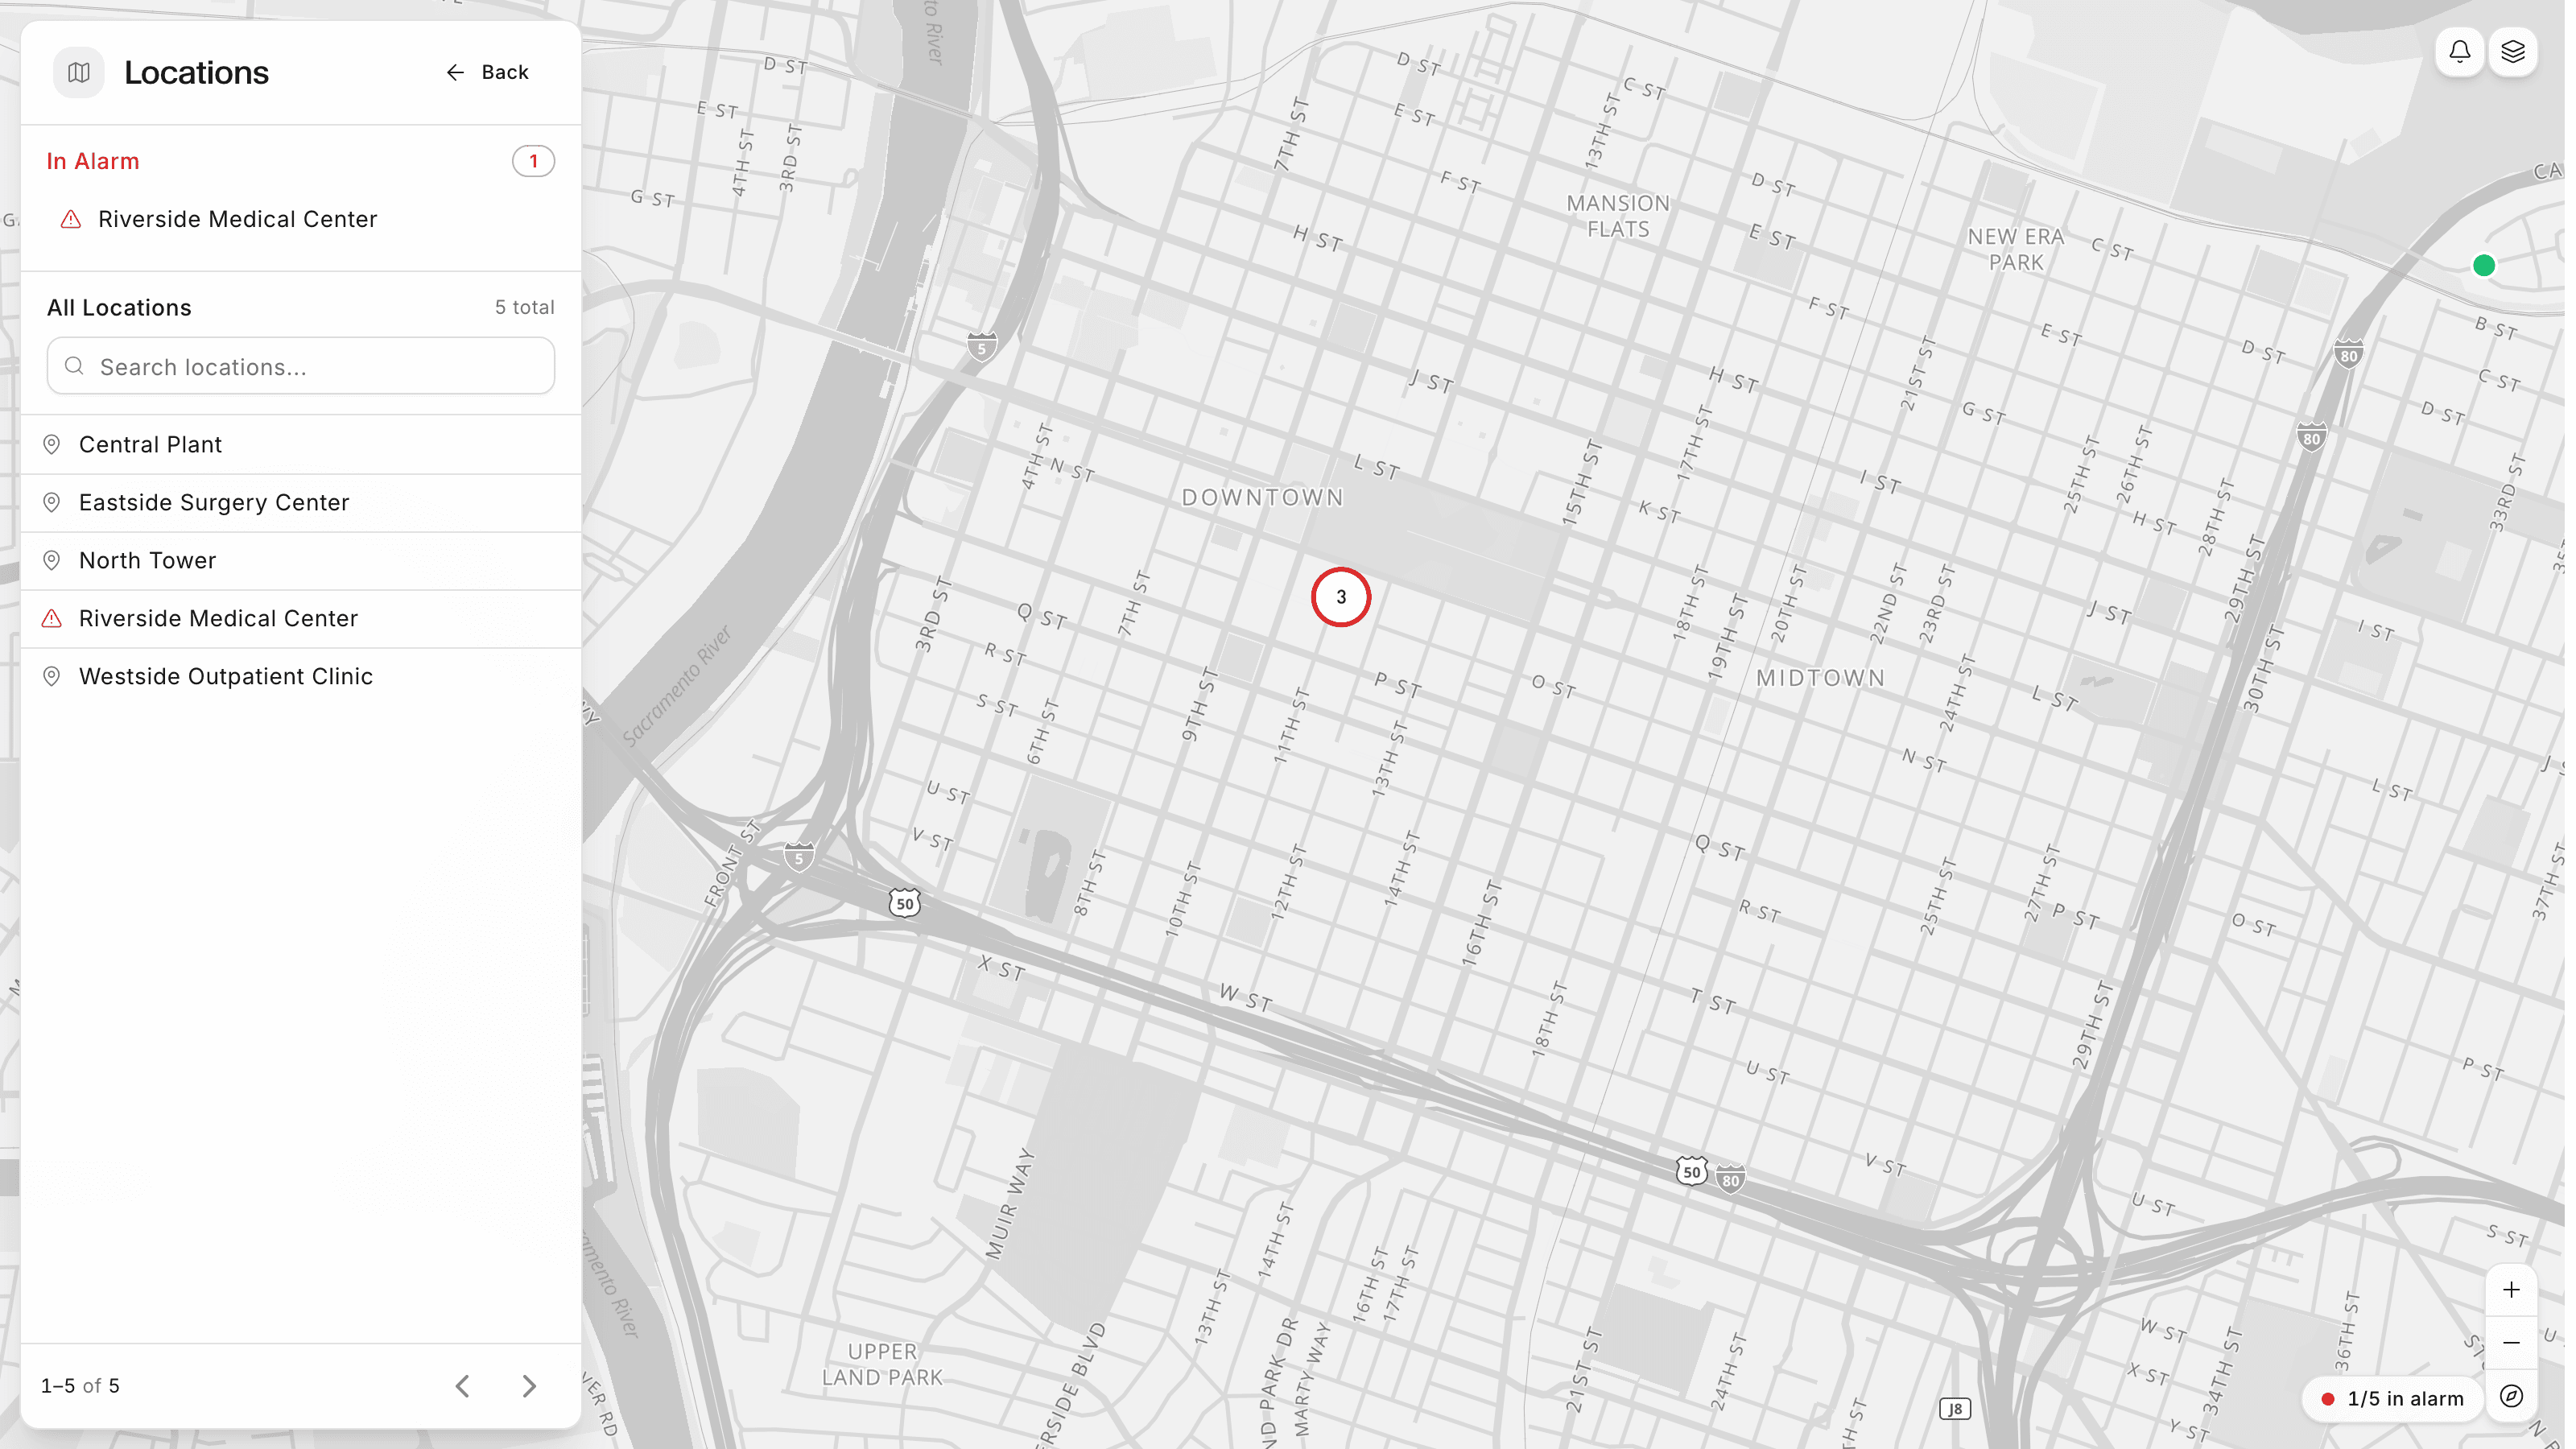
An asset is the thing you actually care about: a generator, a chiller, a pump, a utility service. Devices and sensors serve it, not the other way around.
A single asset can pull data from multiple devices and variables, and a single device can serve multiple assets. That decoupling is the point: the instrumentation can change, a controller replaced or a sensor rewired to a different gateway, without the operational view changing with it. One boiler room controller might report five variables, three of which combine into a boiler asset and two into a feedwater pump asset. Attach Variables on the asset's admin page wires up the data sources, and only a name is required to create an asset, so a manufacturing plant or a data center can model its fleet first and connect instruments as they come online.
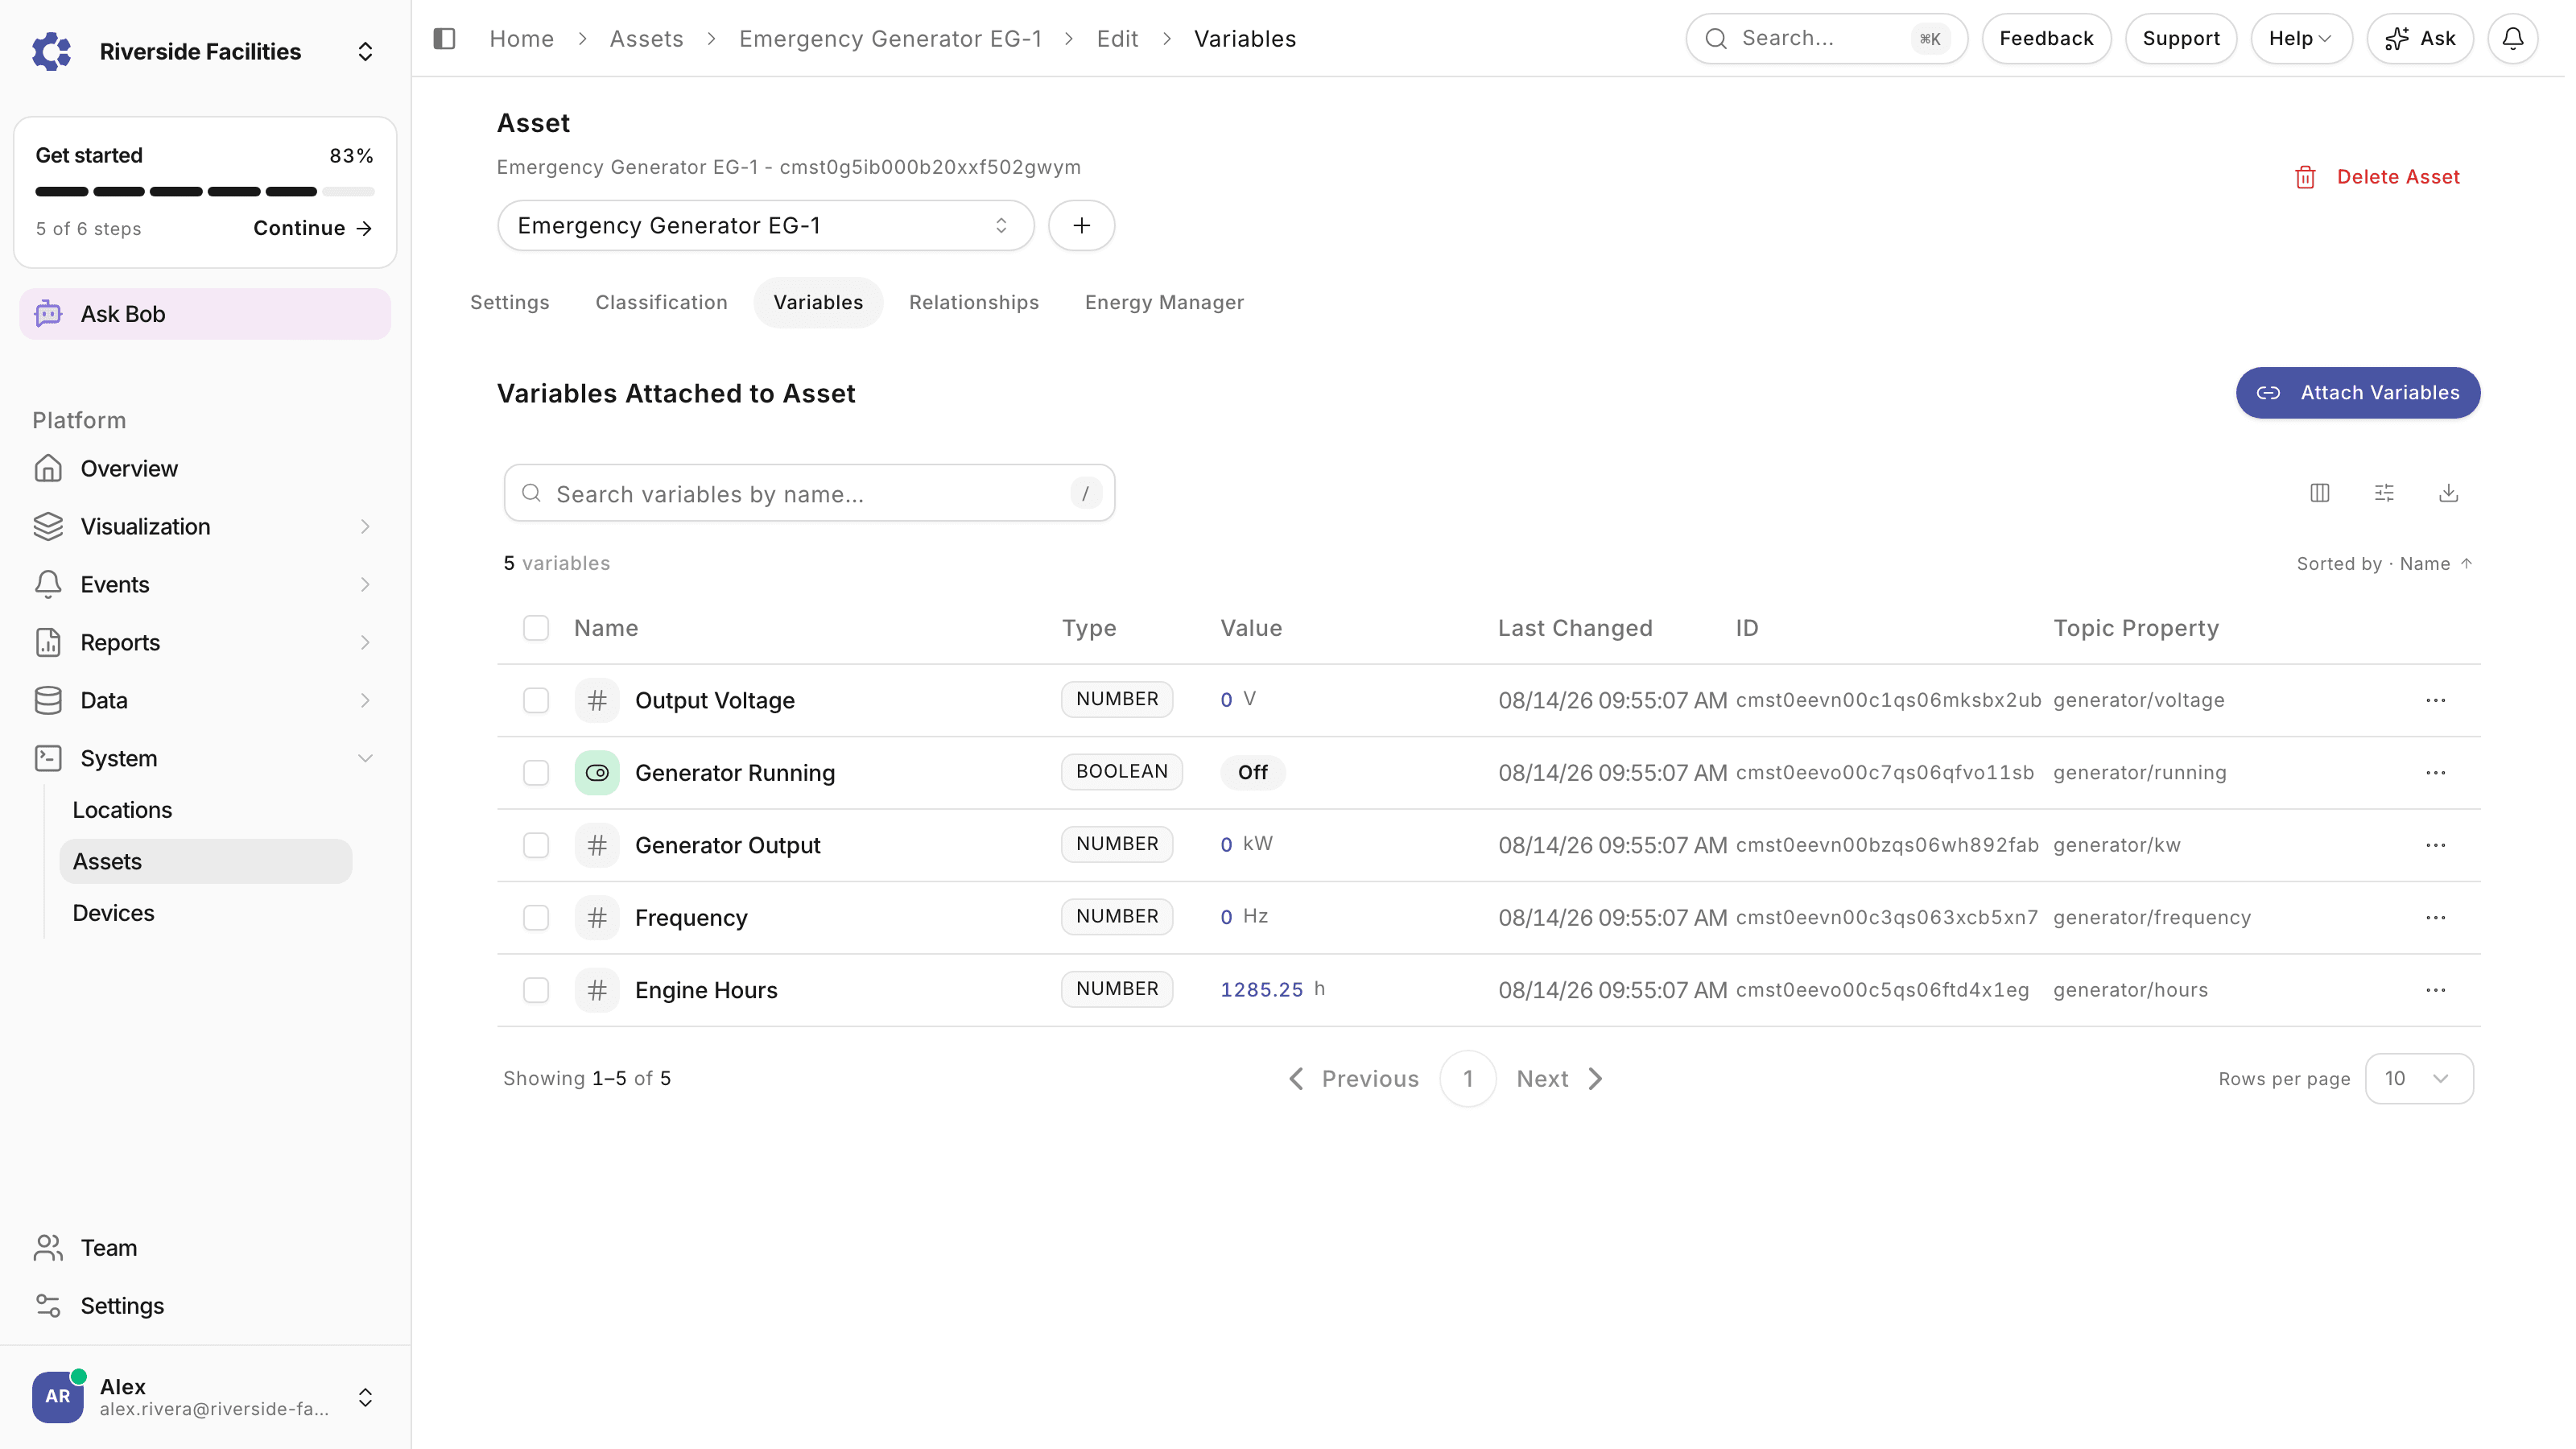
Each asset has a detail page that surfaces the variables it is tied to, live and historical, an asset-level dashboard, active alarms, reports generated against it, and a notification log of recent alerts. Alarms fire on threshold crossings or state changes and route to email, SMS, or in-app notifications configured per user. Compliance and runtime reports are generated against assets rather than raw devices, which is why attaching the right variables early pays off later in analytics and reporting.
An asset is any physical or logical thing you monitor and control, independent of the device that happens to be measuring it. In practice assets take shapes like physical equipment (generators, HVAC units, pumps, motors, chillers), utility connections for electrical, water, and gas service, logical groupings of related equipment, spaces such as buildings and rooms, and infrastructure like panels. Each asset is built by attaching the device variables that report on it, often from more than one device, and carries its own metadata: a description, custom attributes, tags, an optional classification that marks what kind of equipment it is, and an optional location. The assets list shows every asset with its type, location, linked dashboard, and coordinates. Only a name is required to create one, so modeling can start before all the instrumentation exists.
Devices are the hardware that connects to the platform, variables are the individual data points each device reports, and assets sit on top as the operational view. A single asset can pull from multiple devices, and a single device can serve multiple assets: one boiler room controller might report five variables, three combining into a boiler asset and two into a feedwater pump asset. This decoupling means instrumentation changes, a replaced controller or a sensor rewired to a different gateway, never force you to rebuild dashboards, alarms, or reports, because those are all attached to the asset rather than the instrument. Variables can also be virtual: calculated values derived from other variables rather than read from hardware. Alarms watch variables and surface on the asset they belong to, so operators think in terms of equipment, not tag lists.
Two mechanisms work together. Alarms are rules you write: this variable, this operator, this threshold, firing the moment a reading crosses it, notifying people by email, SMS, or in-app notification. Anomaly detection needs no rule at all: it learns each numeric variable's baseline from its own previous fourteen days, compared hour band by hour band so a 3am reading is judged against other nights, and it raises an event when a value drifts out of range, a sensor sticks flat while its history says it should be moving, or data stops arriving. When several variables on one asset go quiet together, the findings group into a single incident, and if a related asset picks up the load within hours, the incident is upgraded to a load switchover naming the asset that took over.
Four complementary structures cover it. Assign each asset to a location to enable site-based filtering and the geographic map view, which draws every site and its assets on one map. Build parent-child hierarchies for facility, equipment, and component drilldowns. Add tags for flexible groupings that cut across the hierarchy, such as critical or q4-maintenance, and set a classification per asset to unlock type-specific monitoring widgets and reports. These are not either-or: a generator can sit under its building in the hierarchy, carry a critical tag, and be classified as a generator all at once. The Namespace view then renders the whole model as one tree, locations, the assets inside them, and the points each asset reads, with a filter toolbar over the top. Location analytics trend efficiency and OEE per site, so fleet comparisons use the same structure.
See ControlCom Connect monitor your own equipment in a 30-minute demo with engineers who have actually run the plant.
Sizing it up?See plans and allotments.