For engineering staff

The monitoring layer your PLCs, BMS and SCADA already speak.

ControlCom Connect gives controls and automation engineers one platform for the equipment they already run: protocol clients for Modbus, OPC UA, BACnet and EtherNet/IP, diagnostics on the gateway, and history queried in place.

Modbus · OPC UA · BACnet · EtherNet/IP · MQTT
What this is

Industrial IoT for engineering staff

Industrial IoT software for engineers connects the PLCs, building controllers, meters and drives already on a site network to one monitoring platform, without reprogramming any of them. The integration work that normally fills a controls engineer's week, custom drivers, register maps, point-to-point exports, becomes protocol clients configured once and maintained in one place.

ControlCom Connect does this through the ControlCom Edge Server, a Docker container running on hardware at the site. It polls Modbus TCP and RTU, OPC UA, BACnet/IP and BACnet MS/TP, and EtherNet/IP, and lands every register, node, object property or tag in a named platform variable. Each client is configured from the platform, and the Edge Server picks the change up on its next restart, so a point change never requires a site visit.

The controllers keep doing control. The platform takes over trending, alarms, dashboards and reports, the parts a PLC was never built to do.

The Tuesday morning this sets up looks different from the one before it: the overnight Live Logs from a distant gateway get read from a desk instead of through a windshield, the points list for whatever arrived on the dock gets verified against the live device with the gateway's ad-hoc tools before any client is committed, and the weekly cross-site comparison comes out of a saved Data Explorer configuration instead of another round of CSV exports and spreadsheet formatting.

The status quo

Where integration time actually goes

Three patterns show up on almost every brownfield site, and none of them is the equipment's fault.

Integration debt

Every data request becomes another one-off

One system wants Modbus registers, another wants OPC UA tags, a third wants a CSV on a share. Each request turns into a custom driver or gateway that one engineer understands and everyone else inherits.

Blind remote sites

Diagnostics still mean a drive and a laptop

When a remote site drops offline, nothing on hand says whether the fault is the device, the network or the configuration. The answer waits until someone plugs in at the panel.

Trapped data

The HMI shows now, not last quarter

Live state lives on the HMI and history sits in a historian few people can query. Comparing this month against last across sites means exports, spreadsheets and an afternoon lost to formatting.

Built for the people doing the integration

Configure, verify, and trend from one place.

The work between a points list and a working dashboard, done from one place.

Collect

Protocol clients configured from the platform, not on a laptop at the panel.

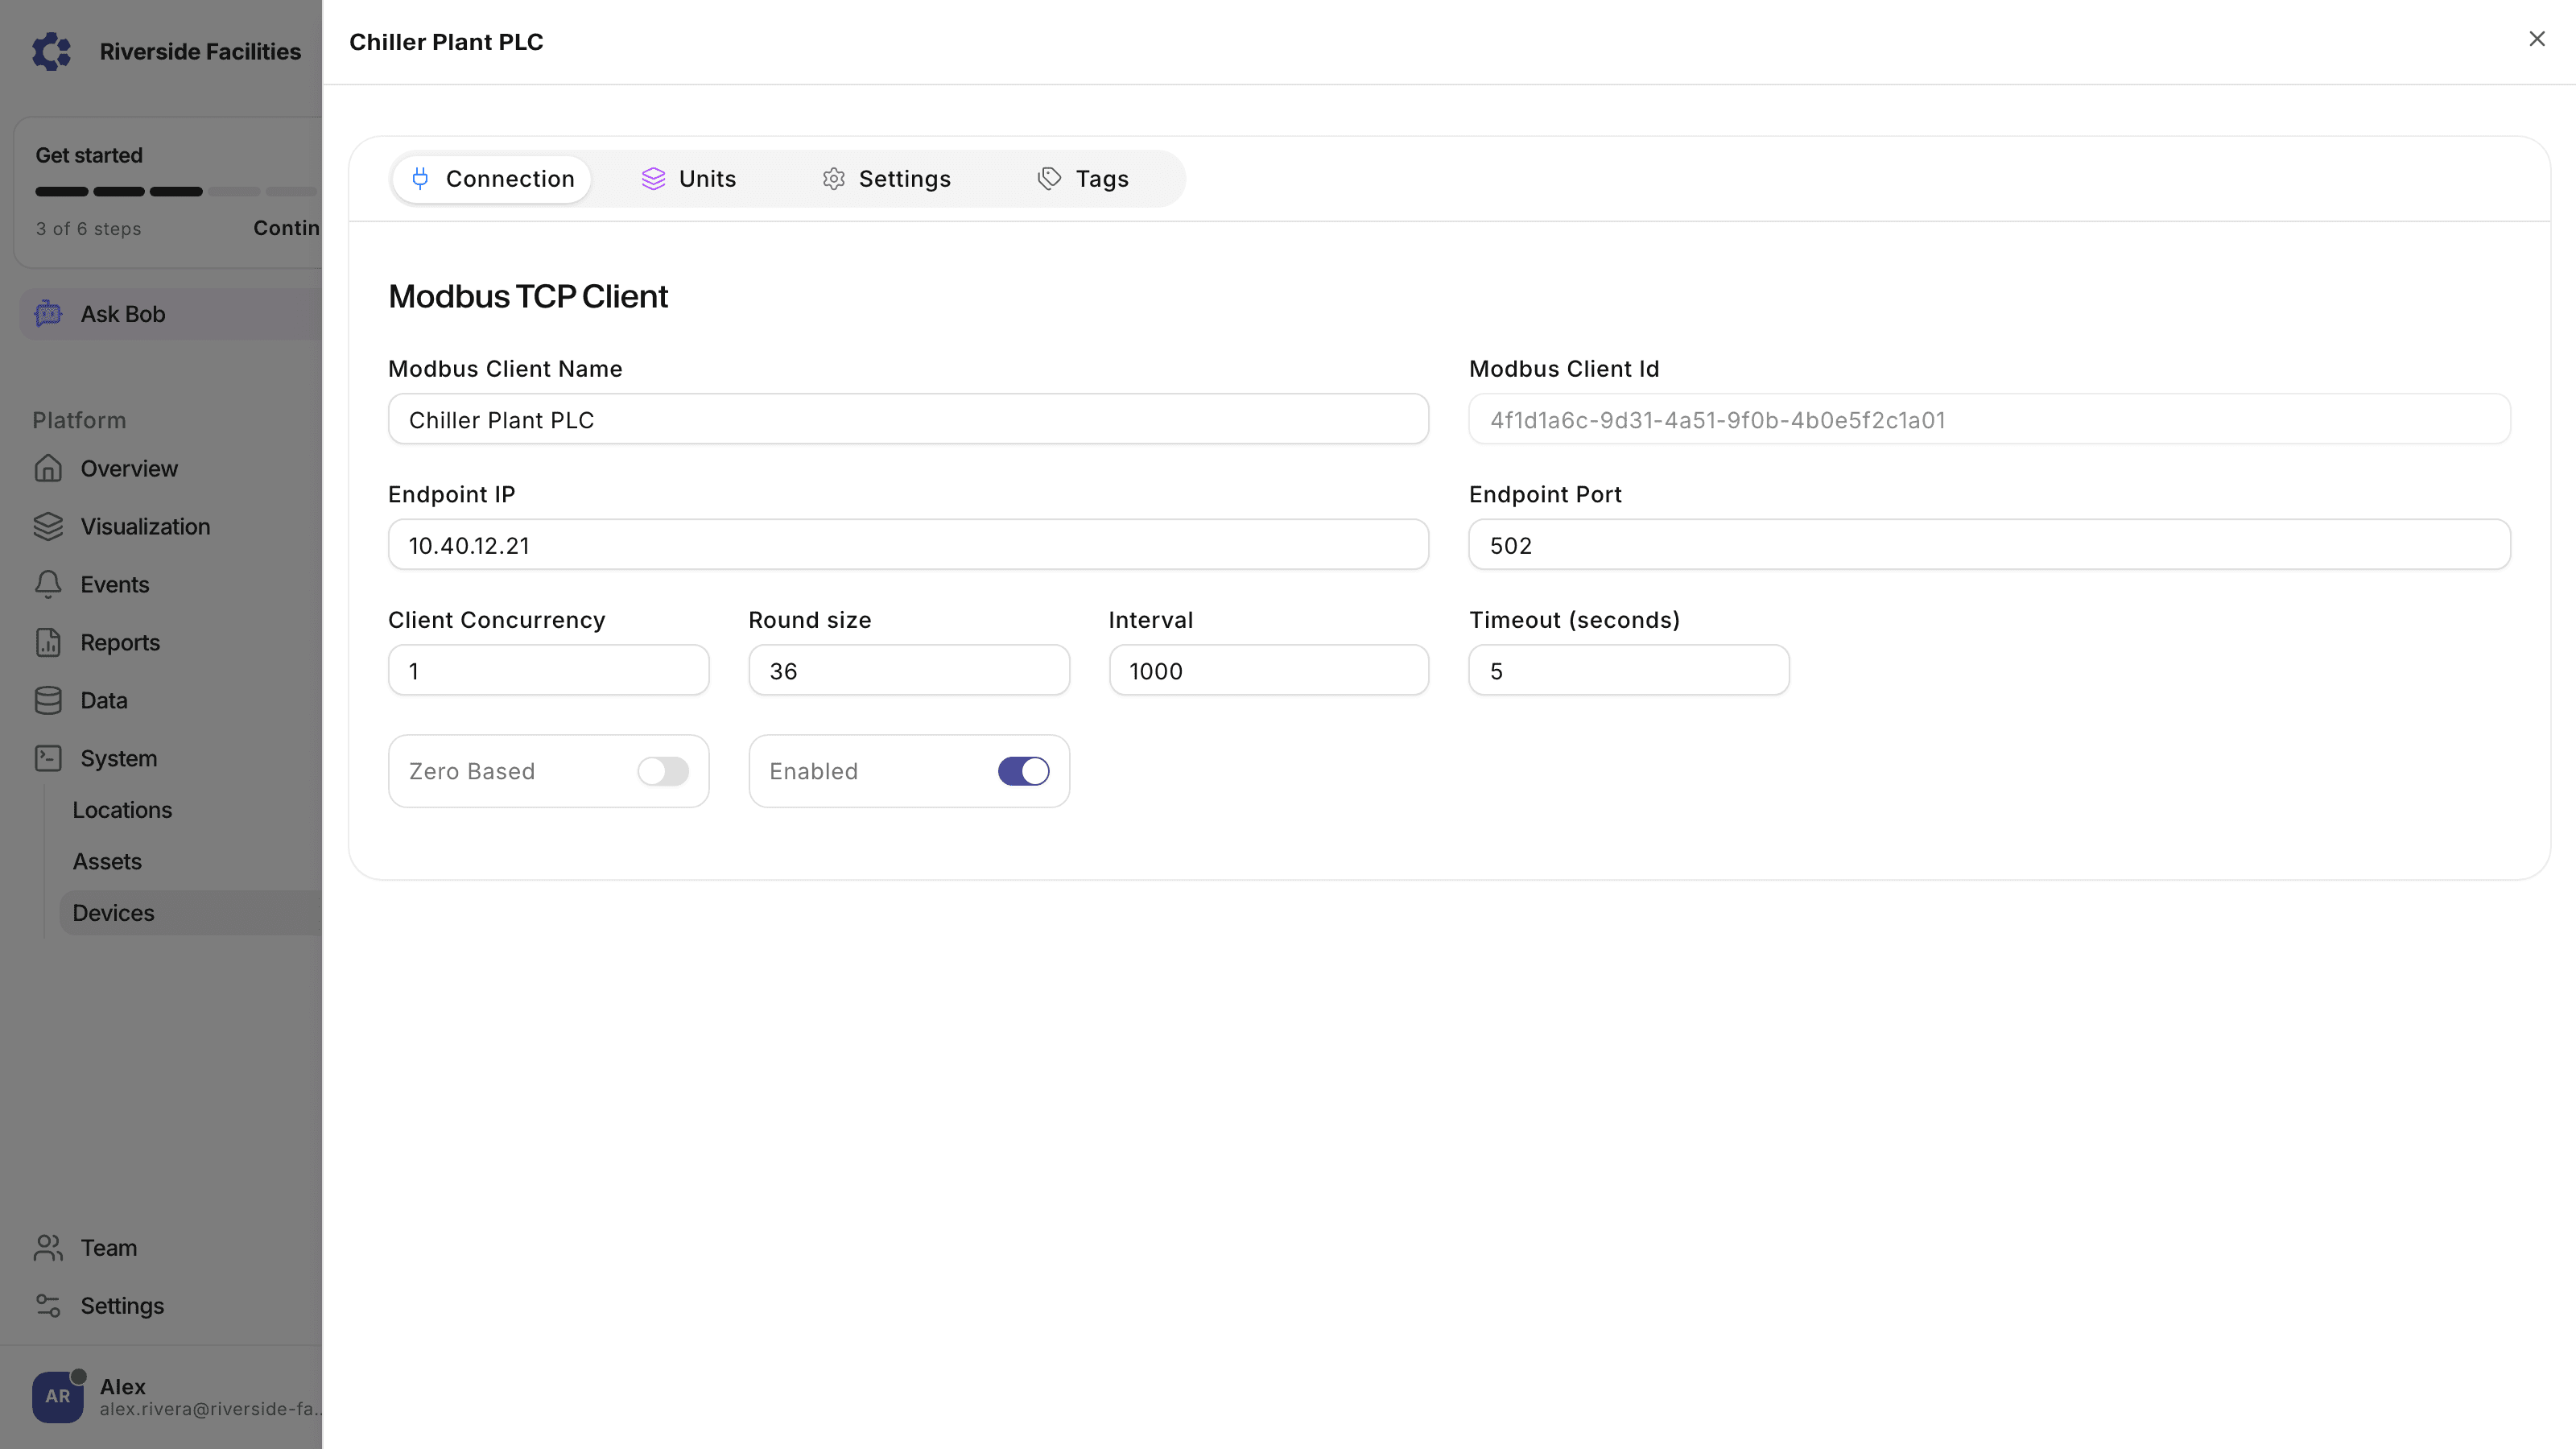
Define a Modbus, OPC UA, BACnet or EtherNet/IP client in the device's SDK Configuration editor, map each register, node, object property or tag to a platform variable, and save. The Edge Server picks the change up on its next restart.

  • Modbus TCP and RTU register and coil polling with per-tag variable mapping
  • OPC UA nodes read from Kepware, Ignition, Siemens, B&R or any compliant server
  • BACnet/IP and MS/TP plus EtherNet/IP tags from Allen-Bradley and Omron PLCs
Modbus client editor on a ControlCom Gateway
Diagnose

System diagnostics that run where the fault is.

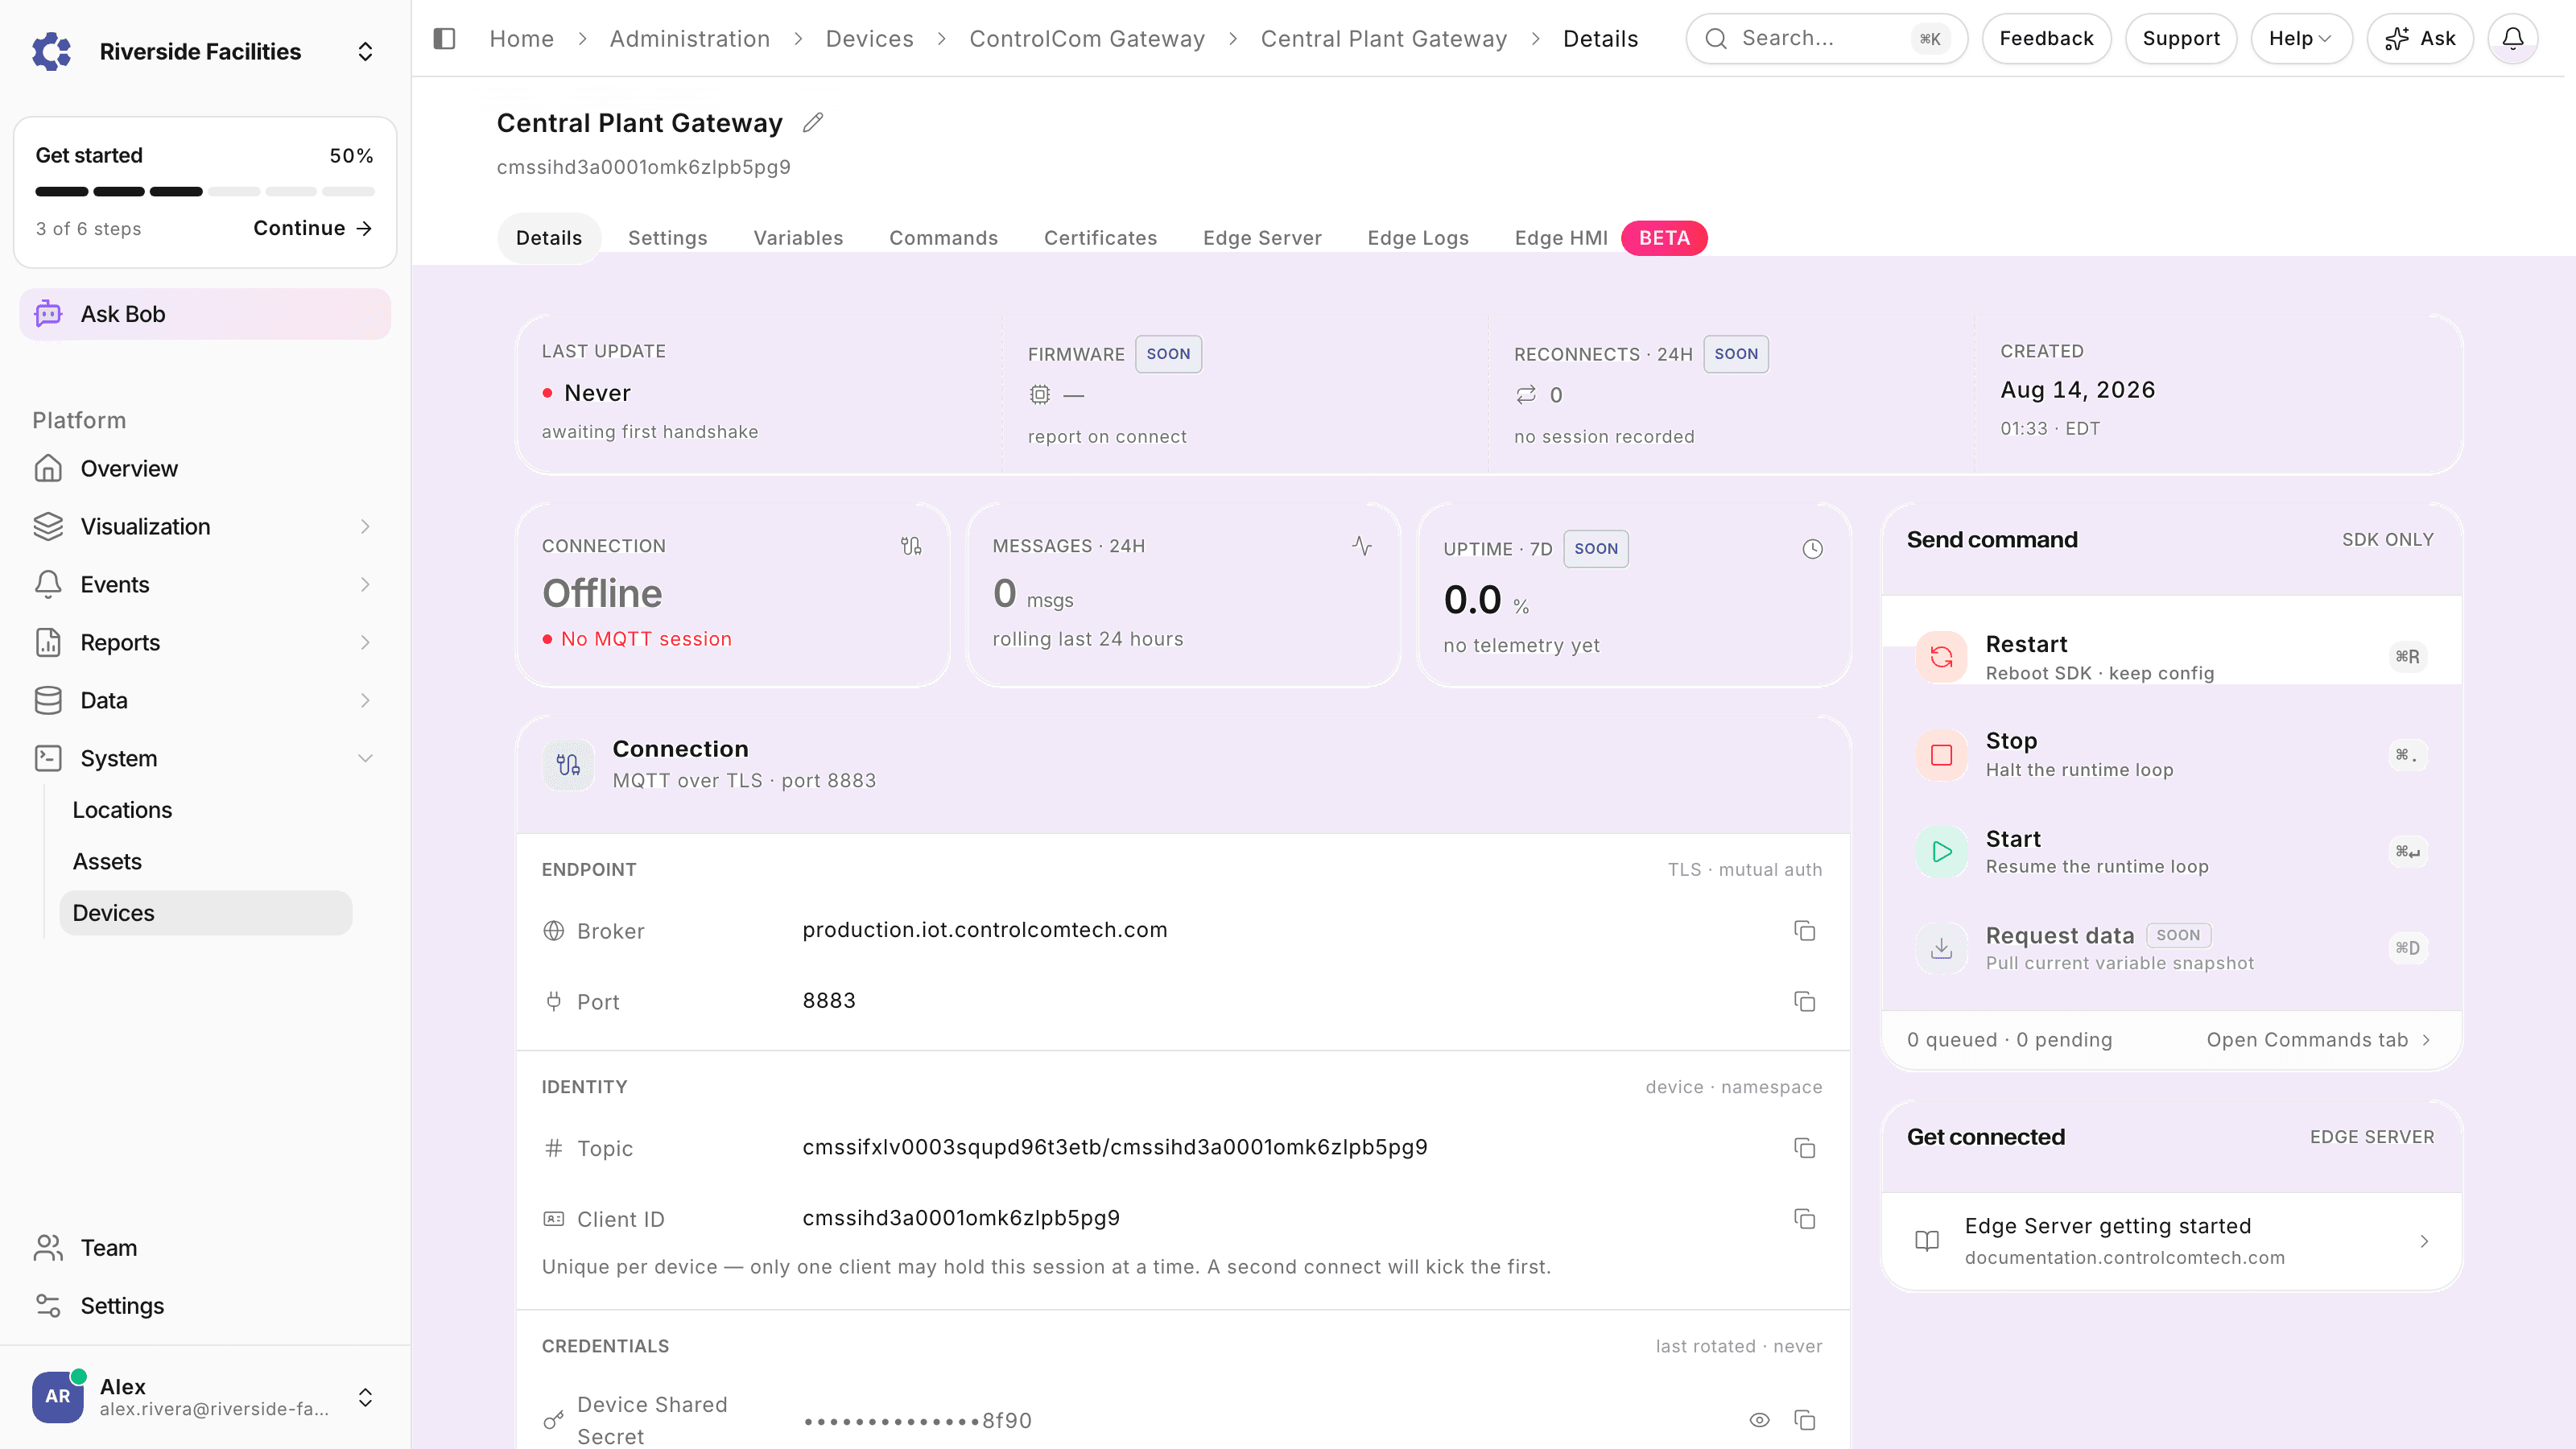
The Edge Server bundles five diagnostic tools that run directly on the gateway: MQTT Explorer, Ping and TCP tests, an ad-hoc Modbus poller, BACnet Who-Is discovery, and Live Logs with runtime log levels. All five are ad-hoc by design, so probing a device never disturbs the production pipeline or pollutes historical data.

  • Verify a register map with the ad-hoc Modbus poller before committing a client
  • Health pages read local endpoints and keep working when the cloud connection is down
  • Live Logs readable remotely from the platform, the first stop when a distant gateway misbehaves
Gateway details page in ControlCom Connect
Analyze

Query history without exporting it first.

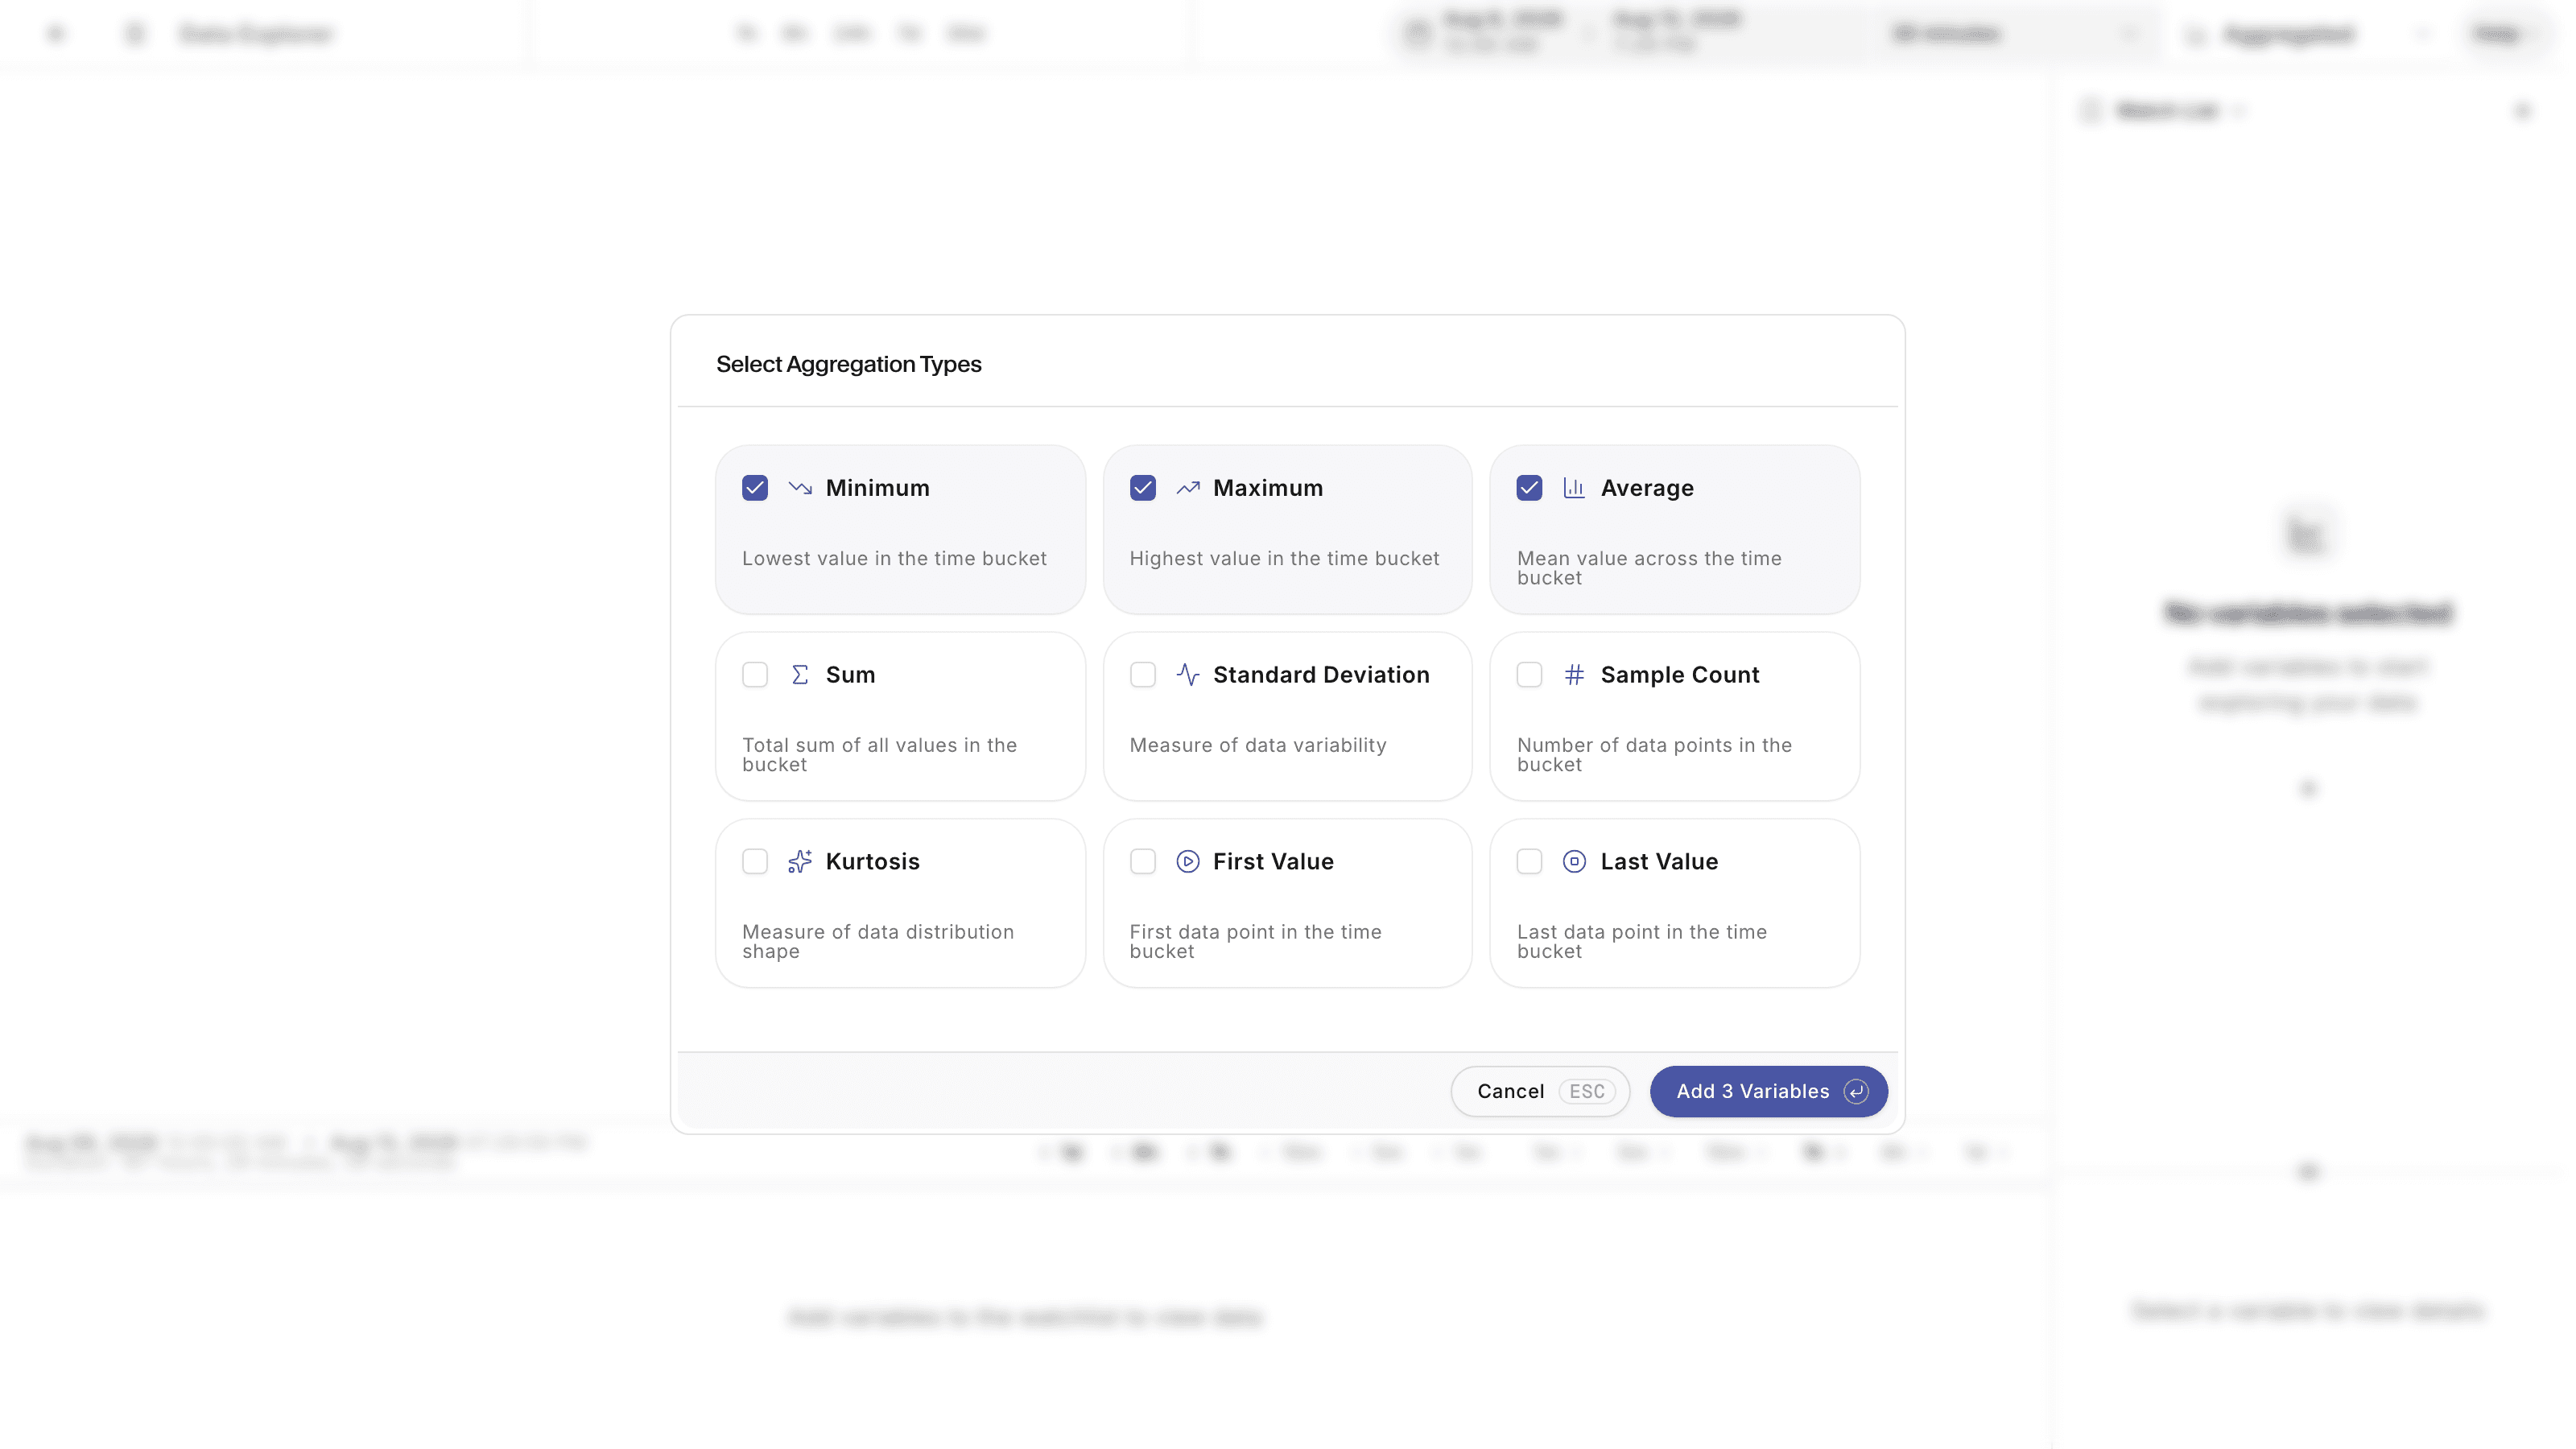
The Data Explorer plots any variable raw, exactly as the device sent it, or aggregated per time bucket over any range. Add the same variable several times with different aggregations to plot minimum, maximum and average together, then pull a CSV of exactly what the chart shows.

  • Raw and aggregated modes with no limit on the number of variables charted
  • Alarm event history with a shortcut from any alarm to its variable in the Explorer
  • Watch lists and saved configurations for the comparisons you run every week
Selecting aggregations in the ControlCom Data Explorer
A worked example

Commissioning the packaged chiller on Dock B, without a laptop at the panel.

The chiller arrives with a Modbus register map in the back of the manual. Before anything touches production configuration, the ad-hoc Modbus poller on the Edge Server reads the documented holding registers straight from the device: add its IP on port 502, pick the data types, and watch the live values. When the 32-bit floats come back scrambled, toggling swapWords on the unit settles the byte order in a minute instead of a support ticket. The verified rows export as CSV, and the real client gets built from that: Add Client in the SDK Configuration editor, Modbus TCP, endpoint and unit, one tag per register mapped to a named variable. The Edge Server picks the client up on its next restart, and by late morning the chiller is an asset trending in the platform, feeding the same alarms and history the equipment performance program runs on.

  • Verify first: the poller reads the device with no client committed and nothing written to history
  • Configure once: the client lives in the platform, not in a file on the box
  • No second visit: tag additions and fixes ship from a desk and land on the next restart
Outcomes

What the integration hours turn into

Zero
Custom drivers to write. Pre-built clients for Modbus, OPC UA, BACnet, and EtherNet/IP replace the one-off gateways.
Planned
Repairs move from callouts to scheduled work as trend data and alarms feed maintenance planning.
10-15%
System efficiency improvement from detailed analytics on the equipment already installed.
Days
From starting the Edge Server container to live data on a dashboard.
Integrate

Existing controllers, BMS and SCADA stay in place

The Edge Server reads what is already there. Nothing on the control side is replaced or reprogrammed.

Protocol coverage

One gateway, every protocol on the site.

A single Edge Server runs Modbus TCP and RTU, OPC UA, BACnet/IP and MS/TP, EtherNet/IP and Sparkplug B clients side by side, so the PLC, the air handler controller and the power meter land in the same platform. The same container handles the secure cloud connection, buffering during outages, and reconnection. How the pieces fit into the Connect, Collect, Store, Analyze, Visualize, Report workflow is laid out in the platform overview, and for teams weighing this against SCADA-native tooling, the Ignition comparison puts the two side by side.

  • PLCs keep their logic, the Edge Server polls values rather than taking over control
  • SCADA stays, the OPC UA client reads existing server tags without touching PLC programs
  • Buffering through outages so a WAN drop does not leave holes in the history
FAQ

Questions engineers ask before wiring it in

Deployment footprint, protocol behavior and failure modes, answered plainly.

Modbus TCP and Modbus RTU, OPC UA, BACnet/IP and BACnet MS/TP, EtherNet/IP for Allen-Bradley and Omron PLCs, and MQTT with Sparkplug B. Each protocol runs as a client on the Edge Server, configured from the platform in the device's SDK Configuration editor rather than in a file on the box. A Modbus client, for example, carries four tabs: Connection for the endpoint IP, port, polling interval and timeout, Units for slave IDs and the bigEndian and swapWords decoding toggles, Settings, and Tags, where each register or coil is mapped to a named platform variable with its data type. The OPC UA client reads nodes from Kepware, Ignition, Siemens, B&R or any other compliant server, and BACnet clients poll object properties the same way. The Edge Server picks up configuration changes on its next restart, so adding a point to a remote site never requires a site visit.

Get started

See it against your own register map.

Bring a points list to a 30-minute demo with engineers who have run the systems, and walk through how it would land in the platform.