Vendor-neutral data center monitoring across every site you run
One platform for switchgear, UPS, generators, PDUs, cooling, and BMS, across every colocation cage, enterprise data center, and edge site. See every system, control every site, from one place.
The white space accumulates equipment from a dozen vendors over decades. The visibility stack should not.
01
01 / Alarm pain
Alarm fatigue across DCIM, BMS, PDU, and UPS portals
Every system in the white space has its own pane of glass: switchgear from one OEM, UPS from another, PDUs from a third, cooling from a fourth. Alarms fire in silos with no correlation, so on-call staff chase noise instead of root cause.
02
02 / Fleet pain
No fleet view across colos and edge sites
Each colocation cage, edge site, and enterprise data center runs its own tools. There is no portfolio rollup of uptime, energy, or capacity, and benchmarking one facility against another means exporting CSVs and stitching them by hand.
03
03 / Vendor pain
OEM-locked switchgear, UPS, and generator data
Schneider, Vertiv, Eaton, ASCO, Russelectric, Cummins. Each OEM portal holds your equipment data hostage between service calls. You pay for the asset, the service contract, and the visibility, and you still cannot get the data out of their cloud and into yours.
04
04 / Compliance pain
Compliance and uptime reporting is a manual scramble
Quarterly generator runtime, monthly UPS battery health, annual uptime SLAs, ESG and Scope 2. The data exists, but it is scattered across portals, spreadsheets, and PDF exports. Audit week is a 40-80 hour fire drill instead of a button click.
Mission-critical facilities
One dashboard for the equipment that keeps the racks up
The same platform engineering services teams use to retrofit paralleling switchgear, operators use to run it once it is live.
ControlCom Connect delivers data center monitoring across the equipment that actually matters when the racks have to stay up: paralleling switchgear, ATS, UPS strings, standby generators, chillers, CRAC/CRAH, branch circuits, and critical loads, from one dashboard. Cross-system alarm correlation. Audit-ready uptime and compliance reporting. Mobile alerts for on-call staff. Vendor-neutral by design, so it works alongside whatever OEM equipment is already in the white space.
Operators in mission-critical facilities spend 30-50% of their time firefighting issues they should have seen coming, and unplanned downtime in data centers runs $100,000+ per hour. The cause is rarely the equipment; it is the visibility stack. A DCIM that does not reach the switchgear, a BMS that does not talk to the generator, an OEM portal for every UPS vendor, and an alarm storm with no correlation. ControlCom Connect collapses that into one pane of glass.
Multi-site operators get a fleet view on day one. Every colocation cage, enterprise data center, and edge site rolled up by region, tier, or customer. The same data that runs daily operations runs the audit: generator runtime, UPS battery health, uptime SLAs, and Scope 2 energy reporting all export as PDFs on demand. Pre-built protocol connectors and a containerized edge agent mean a site is collecting data within days, not after a six-month custom DCIM integration.
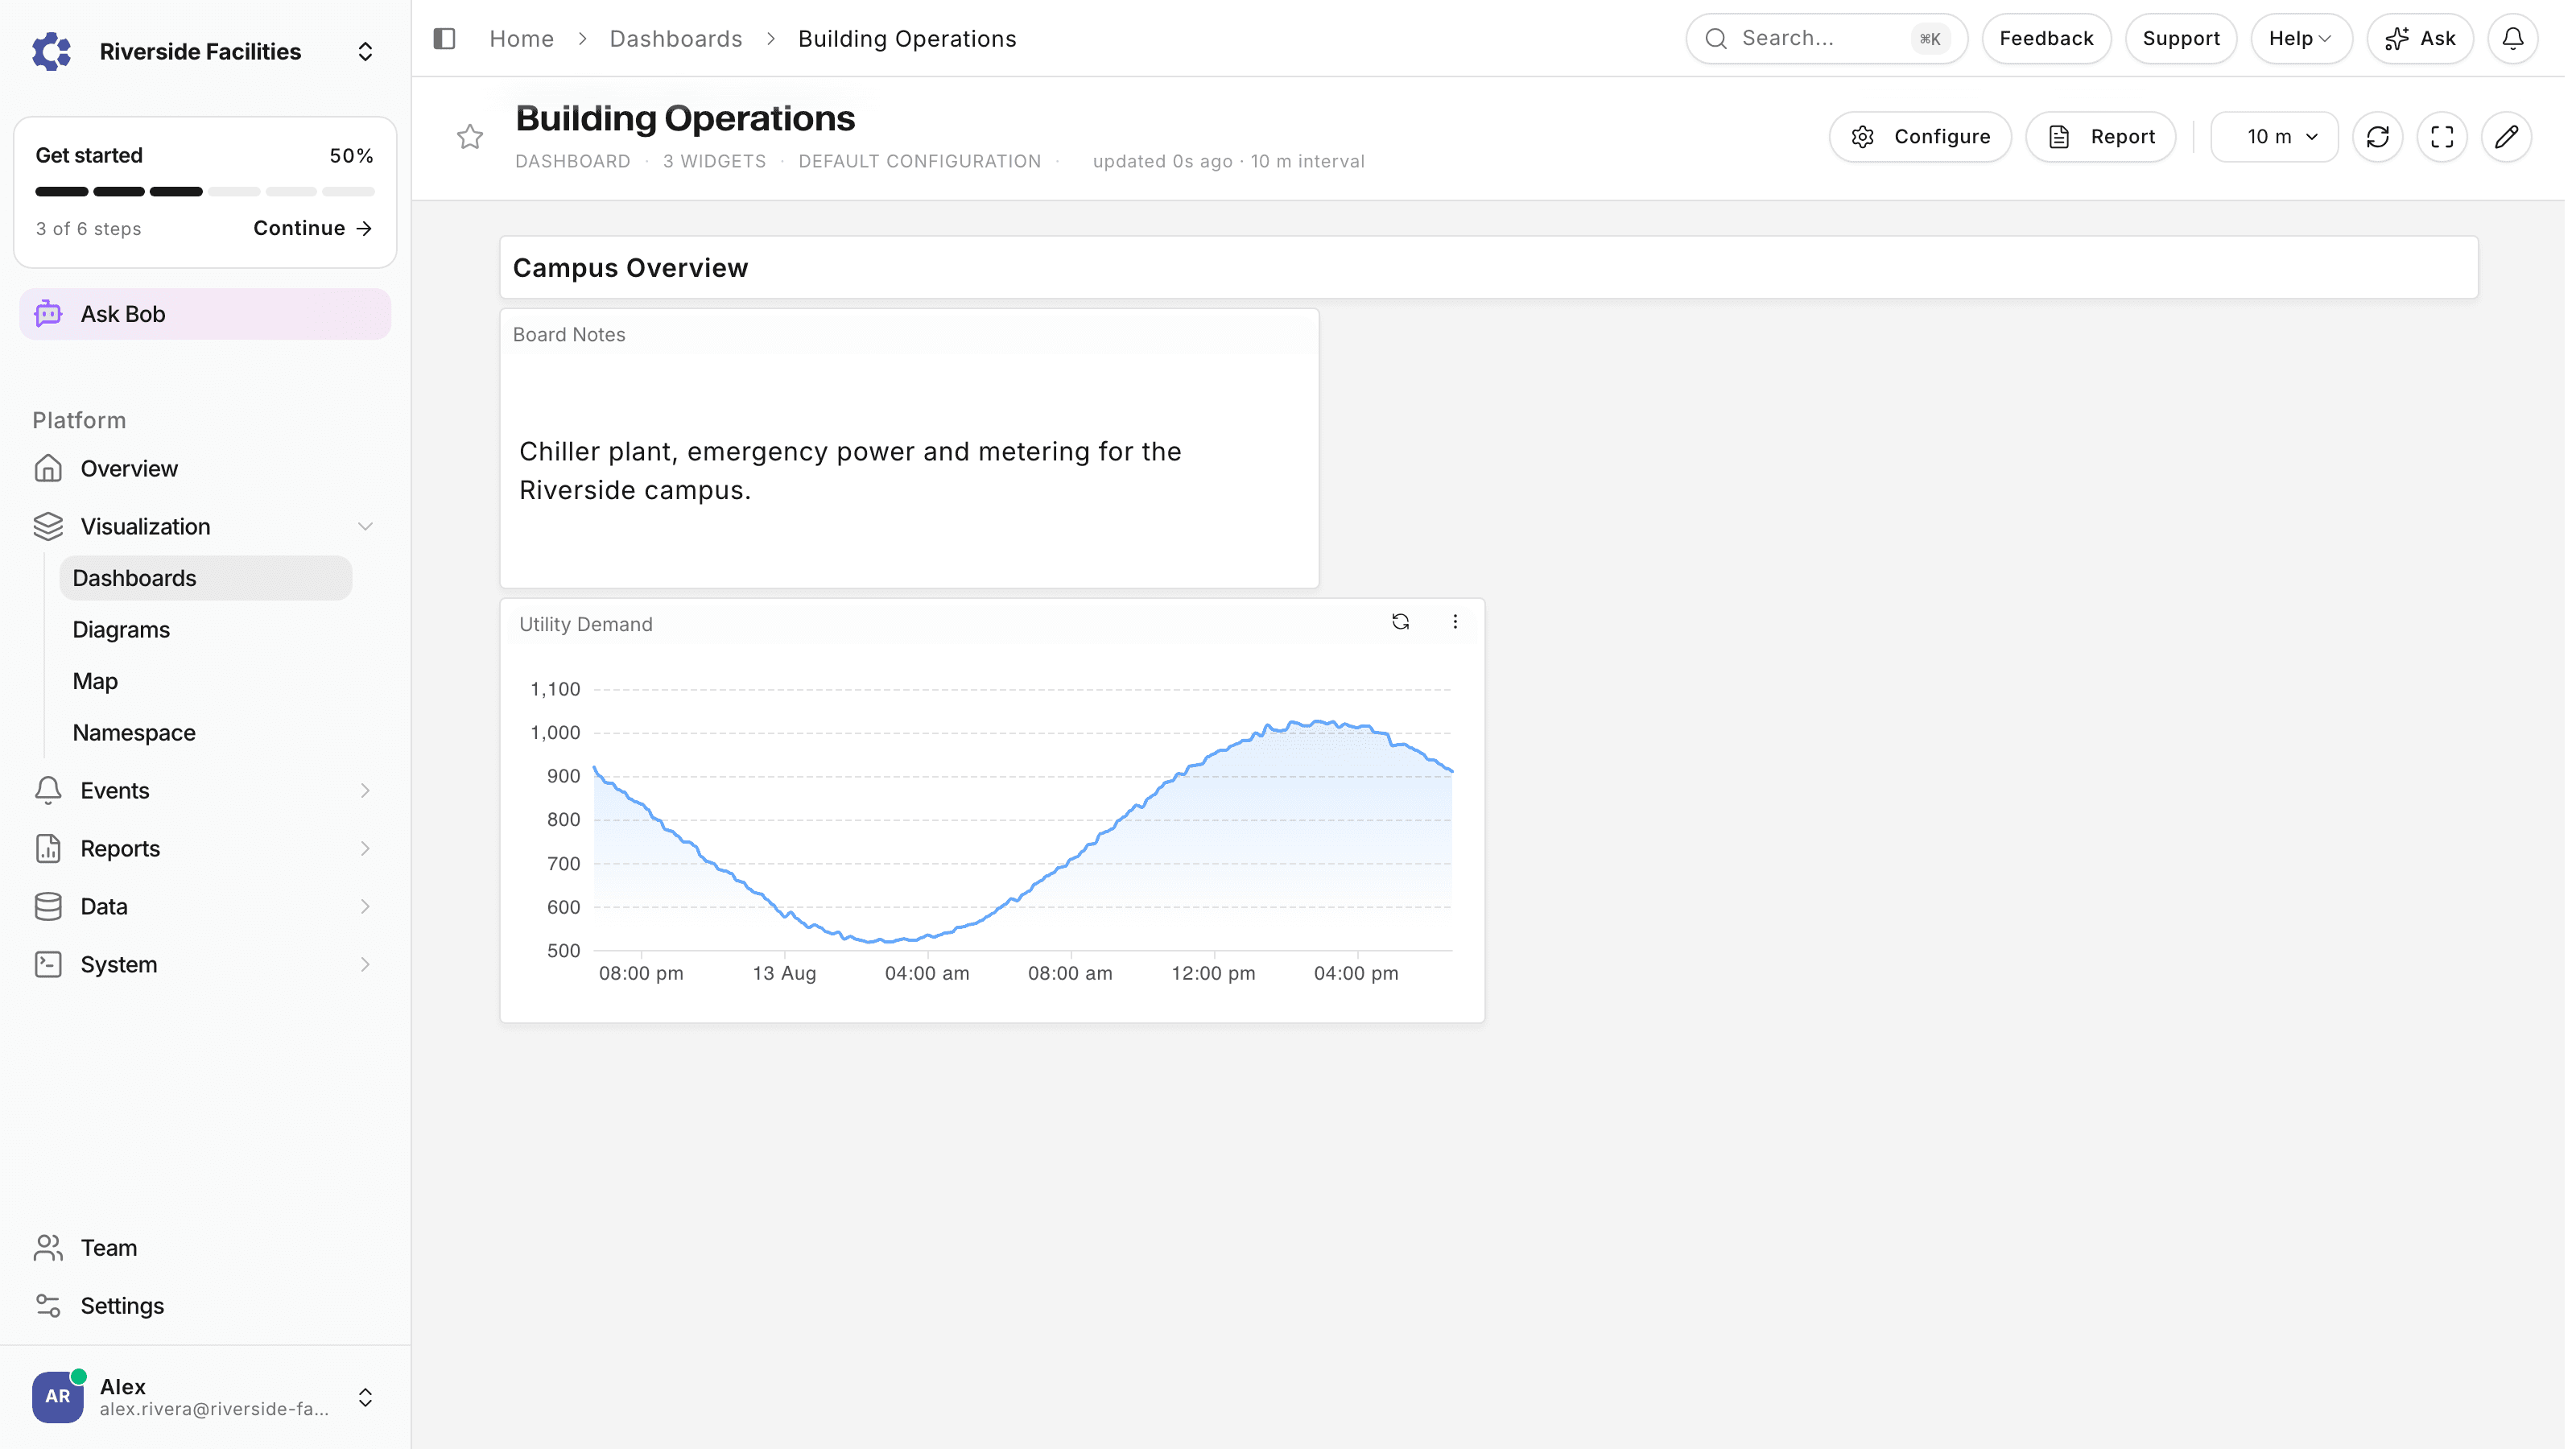
A live dashboard built from switchgear, UPS, generator and cooling readings.
Switchgear, UPS, ATS, and generator monitoring
Multi-site fleet rollup for colo and edge
Cross-system alarm correlation
Audit-ready uptime and compliance exports
What's in the platform
Built for data center monitoring at every tier
The features that matter for Tier III and Tier IV operations, colocation portfolios, and edge fleets, pulled from the same platform that retrofitted the switchgear.
01
Switchgear, UPS, and generator monitoring
Vendor-neutral connectors for paralleling switchgear, UPS strings, ATS, and standby generators: Modbus TCP/RTU, BACnet, OPC-UA, MQTT. Bring legacy Russelectric, ASCO, GE 7700, Cutler-Hammer Digitrip, and modern Schneider, Vertiv, and Cummins gear into one platform.
02
Multi-site fleet rollup for colo and edge
A single portfolio view across every colocation cage, enterprise data center, and edge site you run. Roll up uptime, PUE, capacity, and alarms by region, customer, or tier. Benchmark sites against each other without a custom integration project.
Anomaly detection across the variable space surfaces unusual readings before they trip alarms. Group-based alarms collapse thousands of points into manageable severities, and correlation across DCIM, BMS, PDU, and UPS data cuts mean time to detect on the events that actually matter.
Live power, peak-period tracking, and load-factor analytics across the white space and cooling plant. Continuous metering with weather correlation surfaces the hours that drive demand charges and the chillers operating outside their efficiency curve.
05
Audit-ready compliance and runtime reports
Generator runtime, EPA emissions, UPS battery health, and uptime SLAs, built from the same data the platform already collects. Any dashboard exports as a PDF for any historical date range. Audit week becomes a button, not a scramble.
06
Mobile alerts for on-call staff
Native iOS and Android apps with per-user notification subscriptions, granular severity routing, and SMS, email, and push delivery. The on-call engineer sees the same single pane of glass on a phone at 2am that they see on a workstation at 9am.
Key metrics
The metrics data center monitoring actually moves
Uptime, mean time to detect, mean time to recover, and compliance pass rate. The four numbers Tier III and Tier IV operators are measured on.
99.999%+
Uptime
Concurrently maintainable visibility for Tier III and Tier IV facilities.
MTTD
Mean time to detect
Cross-system anomaly detection and correlated alarms shorten the gap between event and alert.
MTTR
Mean time to recover
Remote diagnostics, mobile alerts, and asset history cut the time from page to resolution.
Audit-ready
Compliance pass rate
Generator runtime, UPS health, and uptime SLAs exported on demand.
Keep exploring
Adjacent pages for mission-critical operators and engineering services buyers.
Common questions from data center, colocation, and mission-critical facility teams evaluating ControlCom Connect.
Yes. ControlCom Connect is designed to sit on top of existing DCIM, BMS, and SCADA, not replace them. Most operators keep their DCIM for asset and capacity tracking and use ControlCom for the layer those tools do not deliver: cross-system data center monitoring, multi-site rollup, mobile access, and the equipment DCIM rarely reaches, paralleling switchgear, standby generators, ATS, branch circuits, and PDUs from multiple vendors. The integration burden is low because the platform reads from the equipment directly over Modbus TCP/RTU, BACnet, OPC-UA, and MQTT rather than through the DCIM, so nothing about the existing deployment has to change. In practice the two systems settle into different jobs: the DCIM answers what is installed and where capacity stands, while ControlCom answers what is happening right now across every system and every site, and pages the on-call engineer when the answer is wrong.
Yes. The platform includes generator compliance reports and EPA runtime reports built from the data it is already collecting. Every generator run is detected automatically, from the generator breaker closing or an ATS run request, and a compliance report is written per run: whether the unit held its configured minimum load for 30 continuous minutes, how each transfer switch performed against its required transfer time, and the specific reason when a test comes back incomplete. The runtime report splits engine hours into emergency and non-emergency time, the split EPA reporting asks for, with custom runtime overrides for runs recorded as routine that were in fact outages. Configurations are re-checked hourly, so a test performed on Tuesday shows up without anyone opening the page. Reports can be generated for any historical date range, exported as PDFs on demand, and regenerated from stored readings if the underlying data changes.
Yes. Multi-site fleet visibility is a default feature, not a custom build. Every colocation cage, enterprise data center, and edge site registers into one asset hierarchy, and portfolio dashboards roll up uptime, energy, PUE, capacity, and alarms across all of them, grouped by tier, region, customer, or any structure you define. Benchmarking works from the same view: compare PUE between facilities, alarm and excursion rates between sites, and generator runtime across the fleet without exporting a single CSV. A map view shows every site colored by alarm state, with live weather overlays, which matters when a storm front is moving across a region of edge sites. Each site keeps its own local dashboards and alarm routing for the operators who run it, while the portfolio level serves operations leadership and the customers who ask how their footprint is doing.
Through pre-built industrial protocol connectors. Modbus TCP/RTU, BACnet, OPC-UA, MQTT, and REST cover the protocols actually deployed on real switchgear, UPS, ATS, PDU, and chiller equipment, which means modern Schneider, Vertiv, Eaton, and Cummins gear and legacy Russelectric, ASCO, GE 7700, and Cutler-Hammer Digitrip equipment land in the same single pane of glass. The vintage of the equipment matters less than whether it exposes a register or a point, and after years of retrofitting paralleling switchgear we have read most of what is out there. For device types that need custom handling, the Edge SDK lets you onboard them visually without writing code, mapping registers to named points once and reusing that definition at every site running the same hardware. If something in your white space speaks none of these protocols, raise it during the demo and we will tell you plainly whether it can be read.
We hold a SOC 2 Type II report (available under NDA), with AES-256 encryption at rest and TLS 1.3 in transit. The edge agent is a Docker container running outbound-only, no inbound firewall holes punched into the OT VLAN. Role-based access, MFA and magic-link sign-in, API keys for the REST API, and audit logging are standard. ControlCom Connect itself is a hosted service on AWS, with no self-hosted version. The component that runs inside your boundary is that edge agent, the ControlCom Edge Server: it evaluates threshold alarms and runs Triggers for protective actions locally, serves Edge HMI panels on the local network, and keeps the site operating when the internet link drops. Local storage buffers unsent readings until the connection returns, and that autonomy was proven during the October 2025 AWS outage: fifteen hours, zero data loss, zero manual intervention.
Days, not months. A containerized edge agent drops on a small box at the site, makes outbound-only connections, and pre-built protocol connectors start pulling from the switchgear, UPS, generators, and cooling plant the same week the project starts, so a working dashboard exists before a traditional DCIM integration would have finished its kickoff meetings. The remaining effort is configuration rather than development: the asset hierarchy, alarm severities and routing groups, the generator report setup, and the portfolio rollup. Multi-site fleets then onboard site by site, with the first facility establishing templates that each subsequent site inherits, so the tenth site goes live faster than the first. There is no per-tag licensing, so instrumenting every branch circuit and every PDU instead of a shortlist is a coverage decision within the data volume and device allotment of your plan rather than a per-point license negotiation, and there is no multi-month custom integration before you start collecting data.
Get started
Pilot data center monitoring on one site
Pick a colocation cage, an enterprise white space, or an edge site. We run the pilot. You see one pane of glass across switchgear, UPS, generators, and cooling, within days, not months. No credit card, no commitment.