Industrial energy management software that pairs continuous metering with peak demand tracking and load factor analytics, across every facility on the bill.
Real-time monitoring · Peak demand control · Utility bill tracking
The category
What energy management software does
Energy management software for industrial sites is a system that meters consumption continuously, tracks peak demand against utility billing periods, and turns the readings into decisions: which loads set the peak last month, which facility drifts overnight, and where the next savings project should start. Without it, the utility bill is the only report, arriving weeks after the waste happened.
ControlCom Connect covers that loop end to end. An Edge Server at each site collects readings from the meters, controllers and building systems you already own; the platform stores them, plots demand in the Data Explorer, and raises alarms the moment consumption crosses a threshold. Its Energy Management tools hold your utility accounts, billing periods and uploaded bills, and report peak demand, energy use and load factor per utility company, so every invoice is checked against your own metered data, not taken on trust.
A team pursuing this outcome is done when three things are routine. A demand alarm reaches someone who can shed load while the billing interval is still open, not on next month's invoice. Every utility bill is reconciled against the platform's own metered record within days of arriving, with the billing period's peak demand, energy use and load factor read from the Energy Management reports rather than rebuilt in a spreadsheet. And the next efficiency project is chosen from Data Explorer comparisons across sites, because the metered evidence names the building, the feeder and the hours where the money is going.
The status quo
Where energy budgets leak
The data exists at every site. It reaches the person who owns the bill too late to act on.
01 / Visibility
The bill is the first report anyone sees
Most facilities learn about a peak weeks later, as a line item on the invoice. By then the load that set it has run the same schedule twenty more times, and nobody can say which interval did the damage.
02 / Fragmentation
Every site meters itself differently
One facility has a BMS, another has panel meters on Modbus, a third has clipboard rounds. Comparing consumption across sites means exporting whatever each one produces and stitching spreadsheets by hand, so it rarely happens.
03 / Demand charges
One short peak prices the whole month
Demand charges are set by the single highest interval in the billing period, not by average use. Without live demand tracking and an alert before the threshold, that interval passes unnoticed and the charge is locked in.
What the platform does
Monitor demand, catch the peak, verify the bill
Three capabilities that map onto the lines of the utility bill: consumption, demand, and the charges built on both.
Facility energy monitoring
See consumption live across every facility
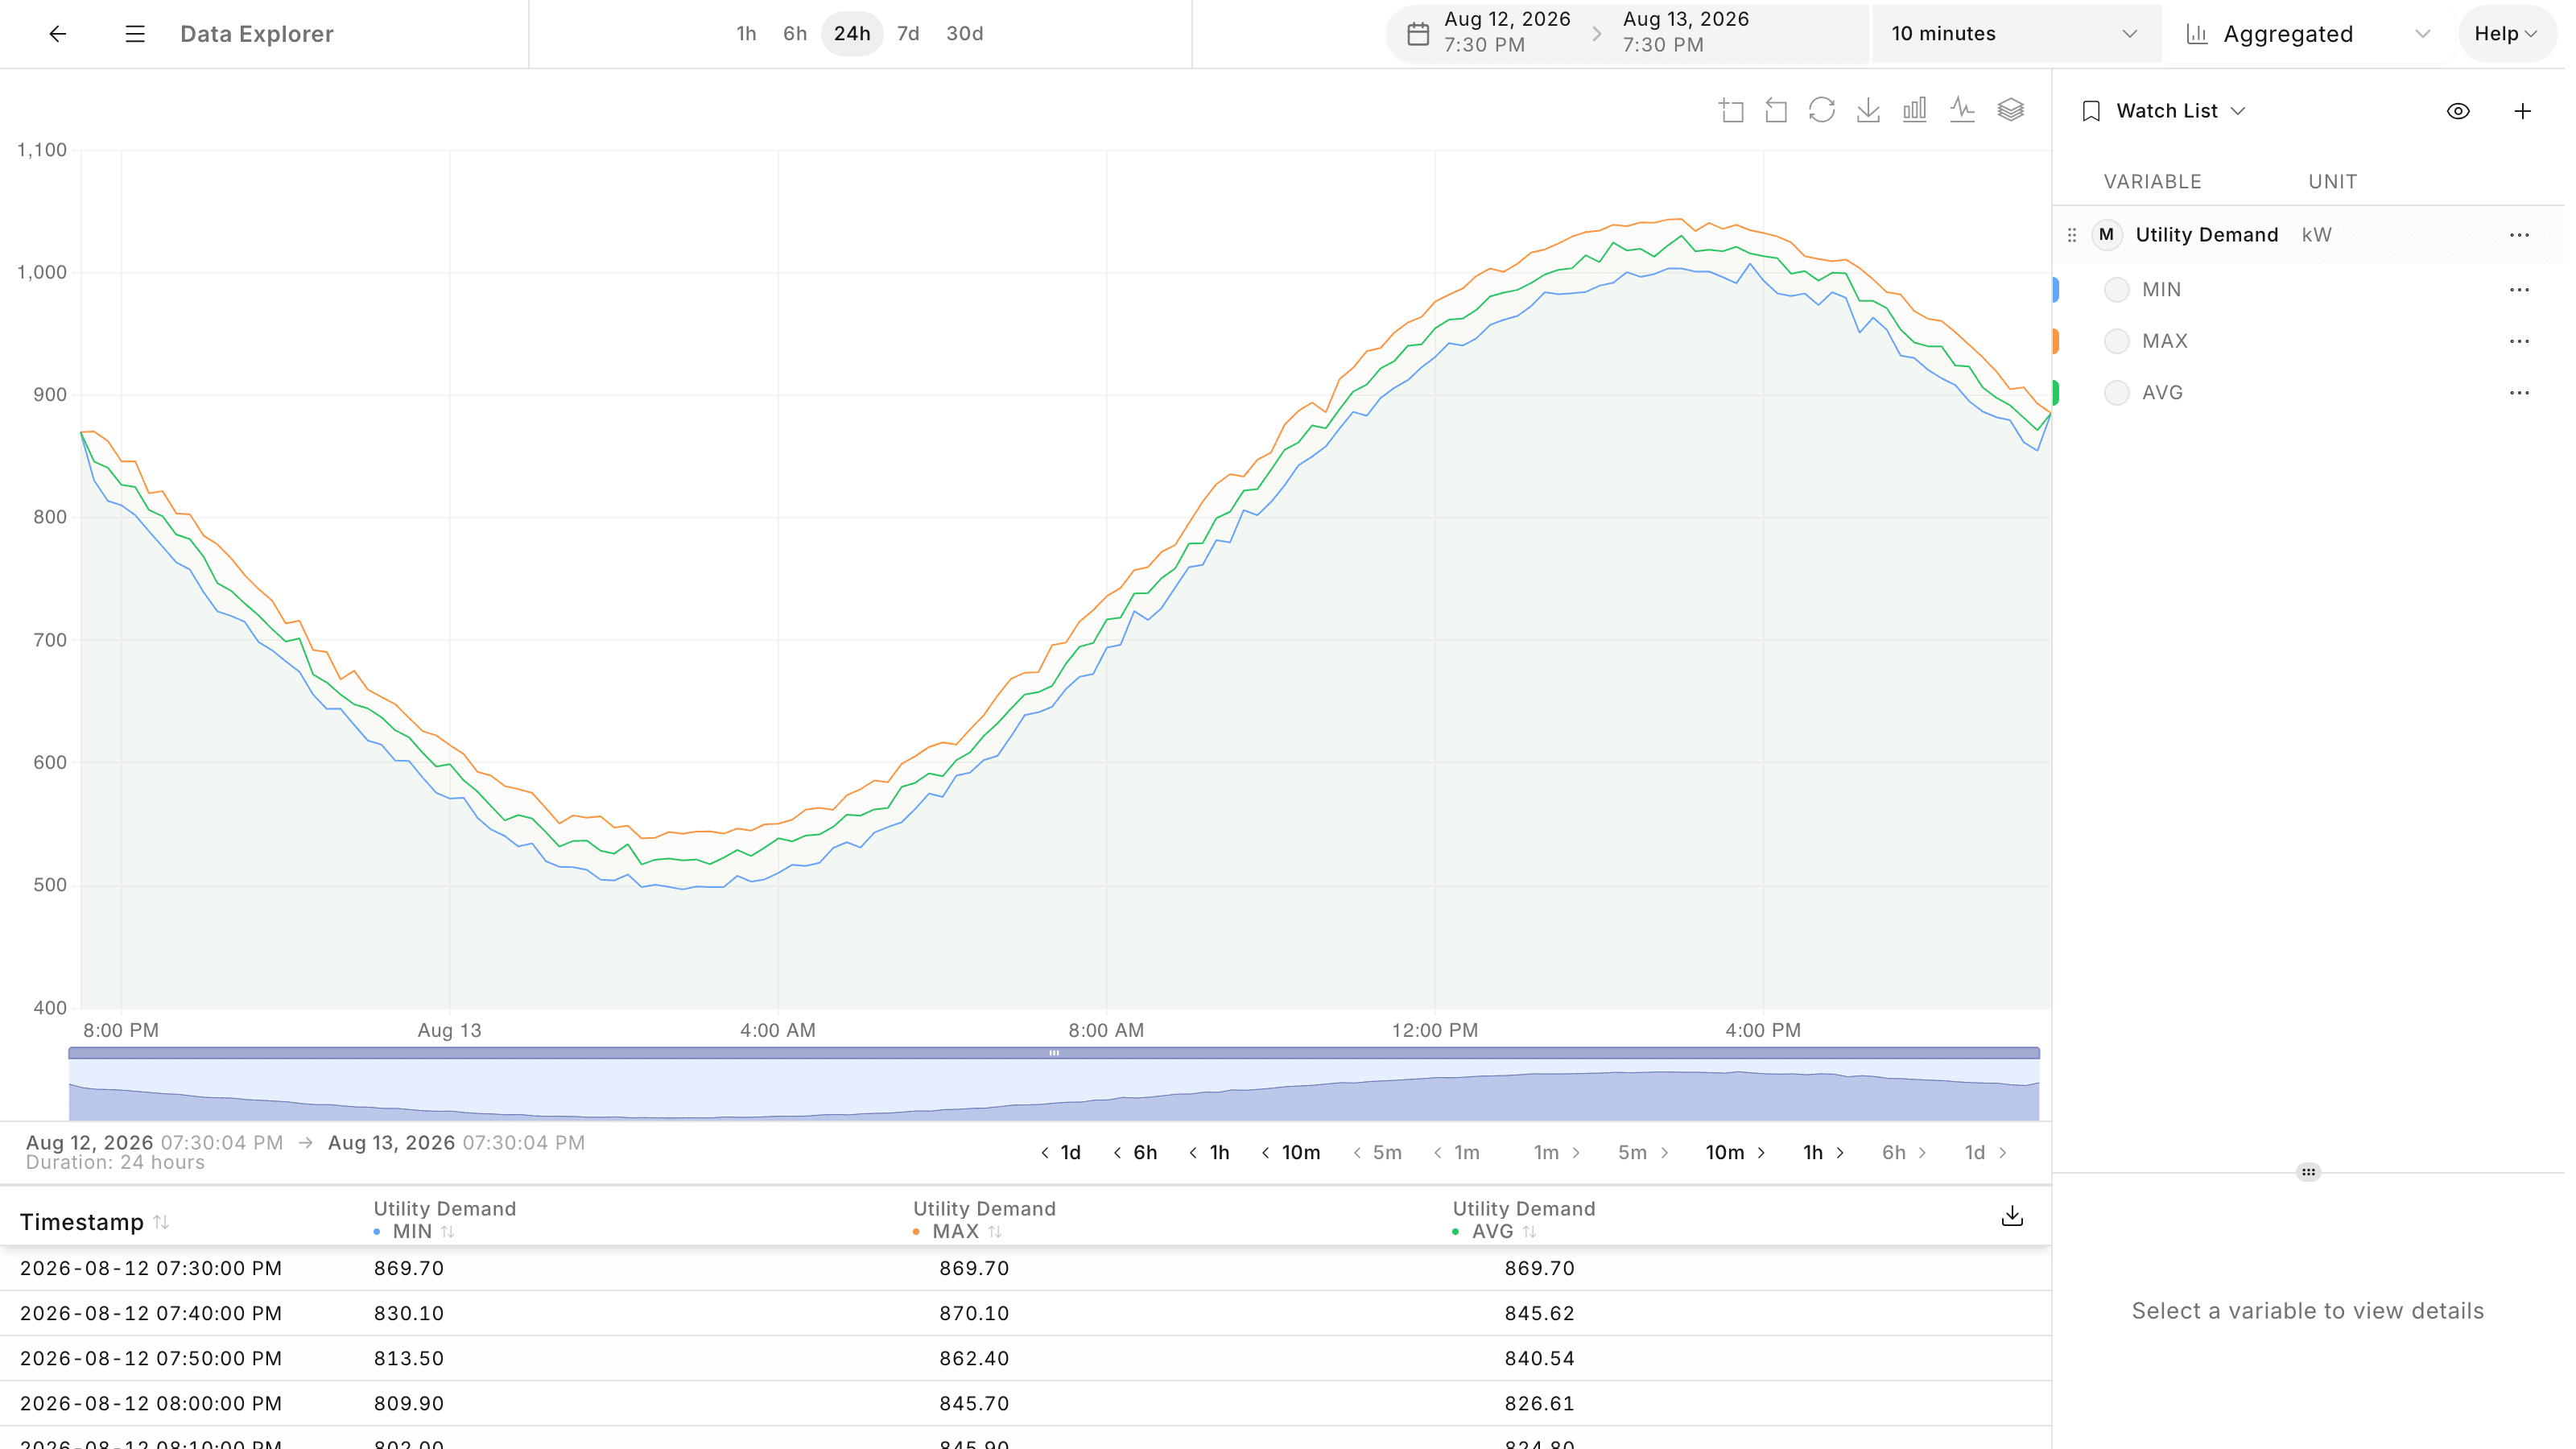
Meters report through an on-site Edge Server, and every reading lands in one place. Dashboards show live demand per site, the Map colors each location by alarm state, and the Data Explorer plots any demand variable, raw or aggregated, with minimum, maximum and average on one chart and CSV export. The same Analyze tooling, covered on the platform analytics page, serves the rest of the equipment too, so the meter data does not live in a separate system from the machines behind it.
Real-time dashboards with graph widgets on live and historical demand
Data Explorer for raw or aggregated readings over any time range
Map view of every location, colored by live alarm state
Peak demand reduction
Catch the peak before it sets the charge
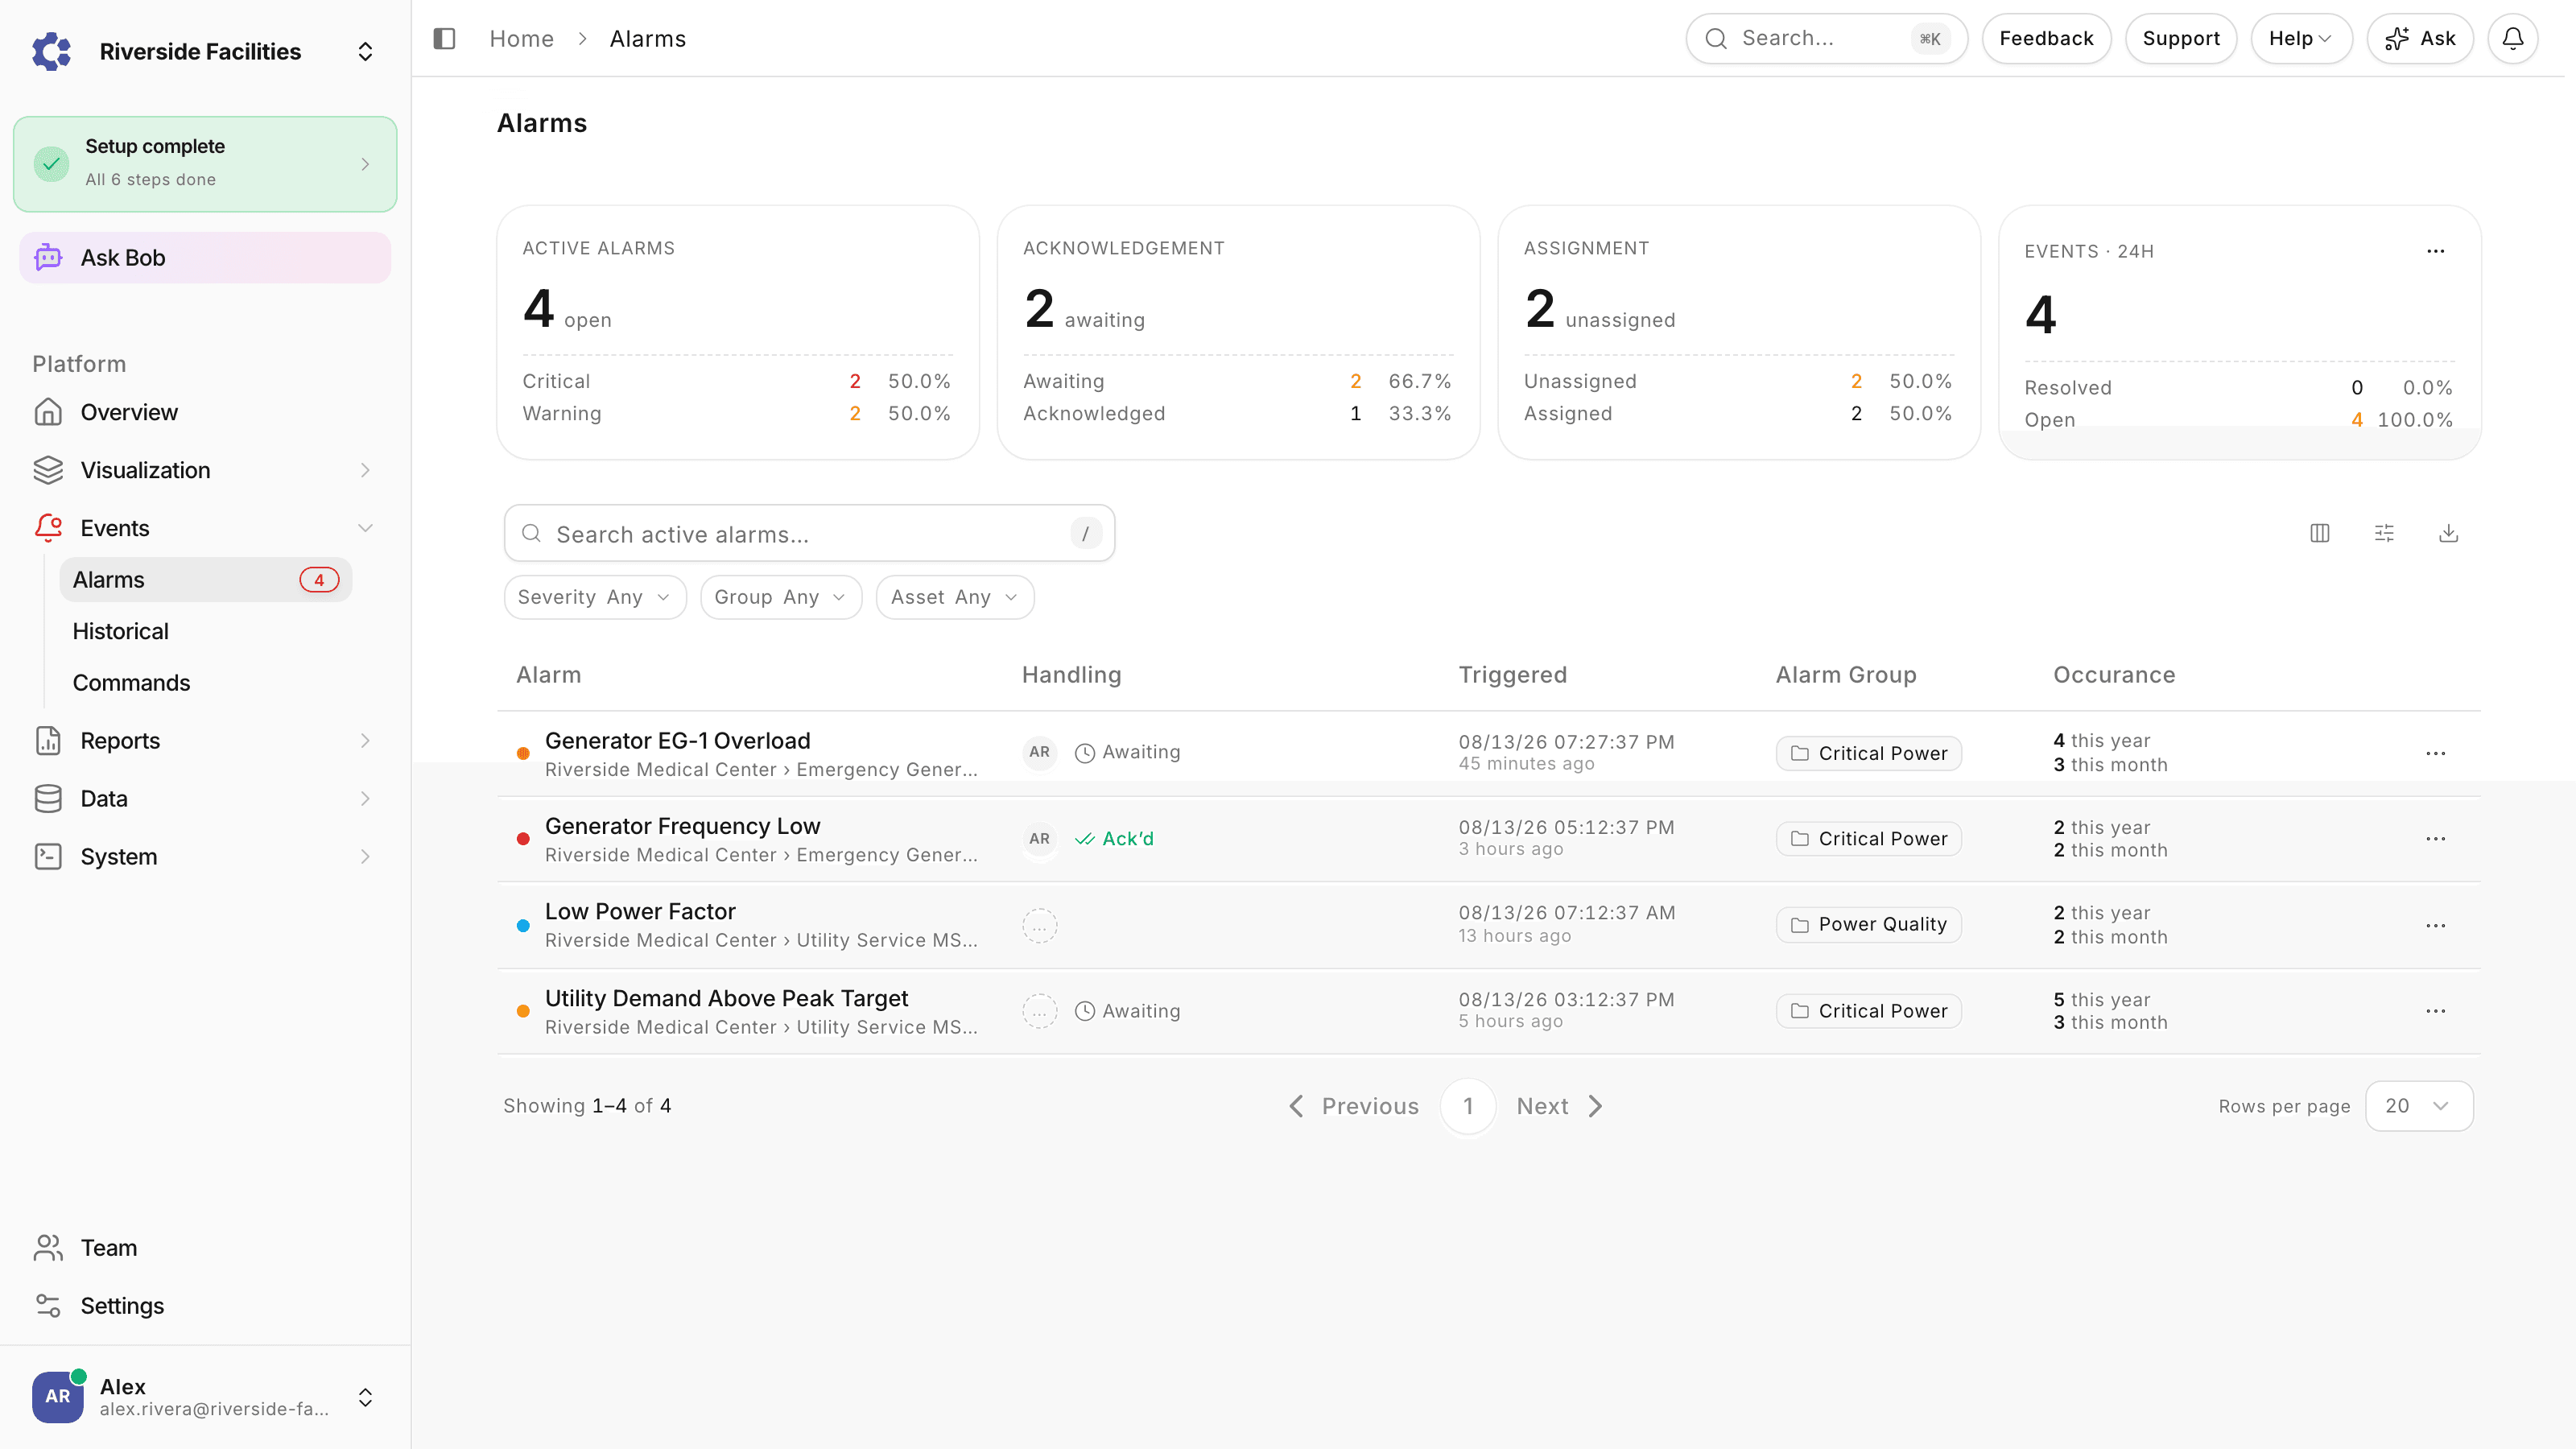
An alarm on a demand variable reaches the people who can shed load by SMS, email or push notification while the interval is still open. Operators act from the same screen: write a new demand limit, or clear a stored peak at the end of a billing period. Load management on live demand data has cut peak demand charges by up to 20 percent. Nowhere is the exposure sharper than in data centers, where the electrical room carries the building around the clock.
Threshold alarms with per-person routing by SMS, email and push
Commands to write demand limits and clear stored peaks
Up to 20% off demand charges through active load management
Energy analytics
Check every invoice against metered data
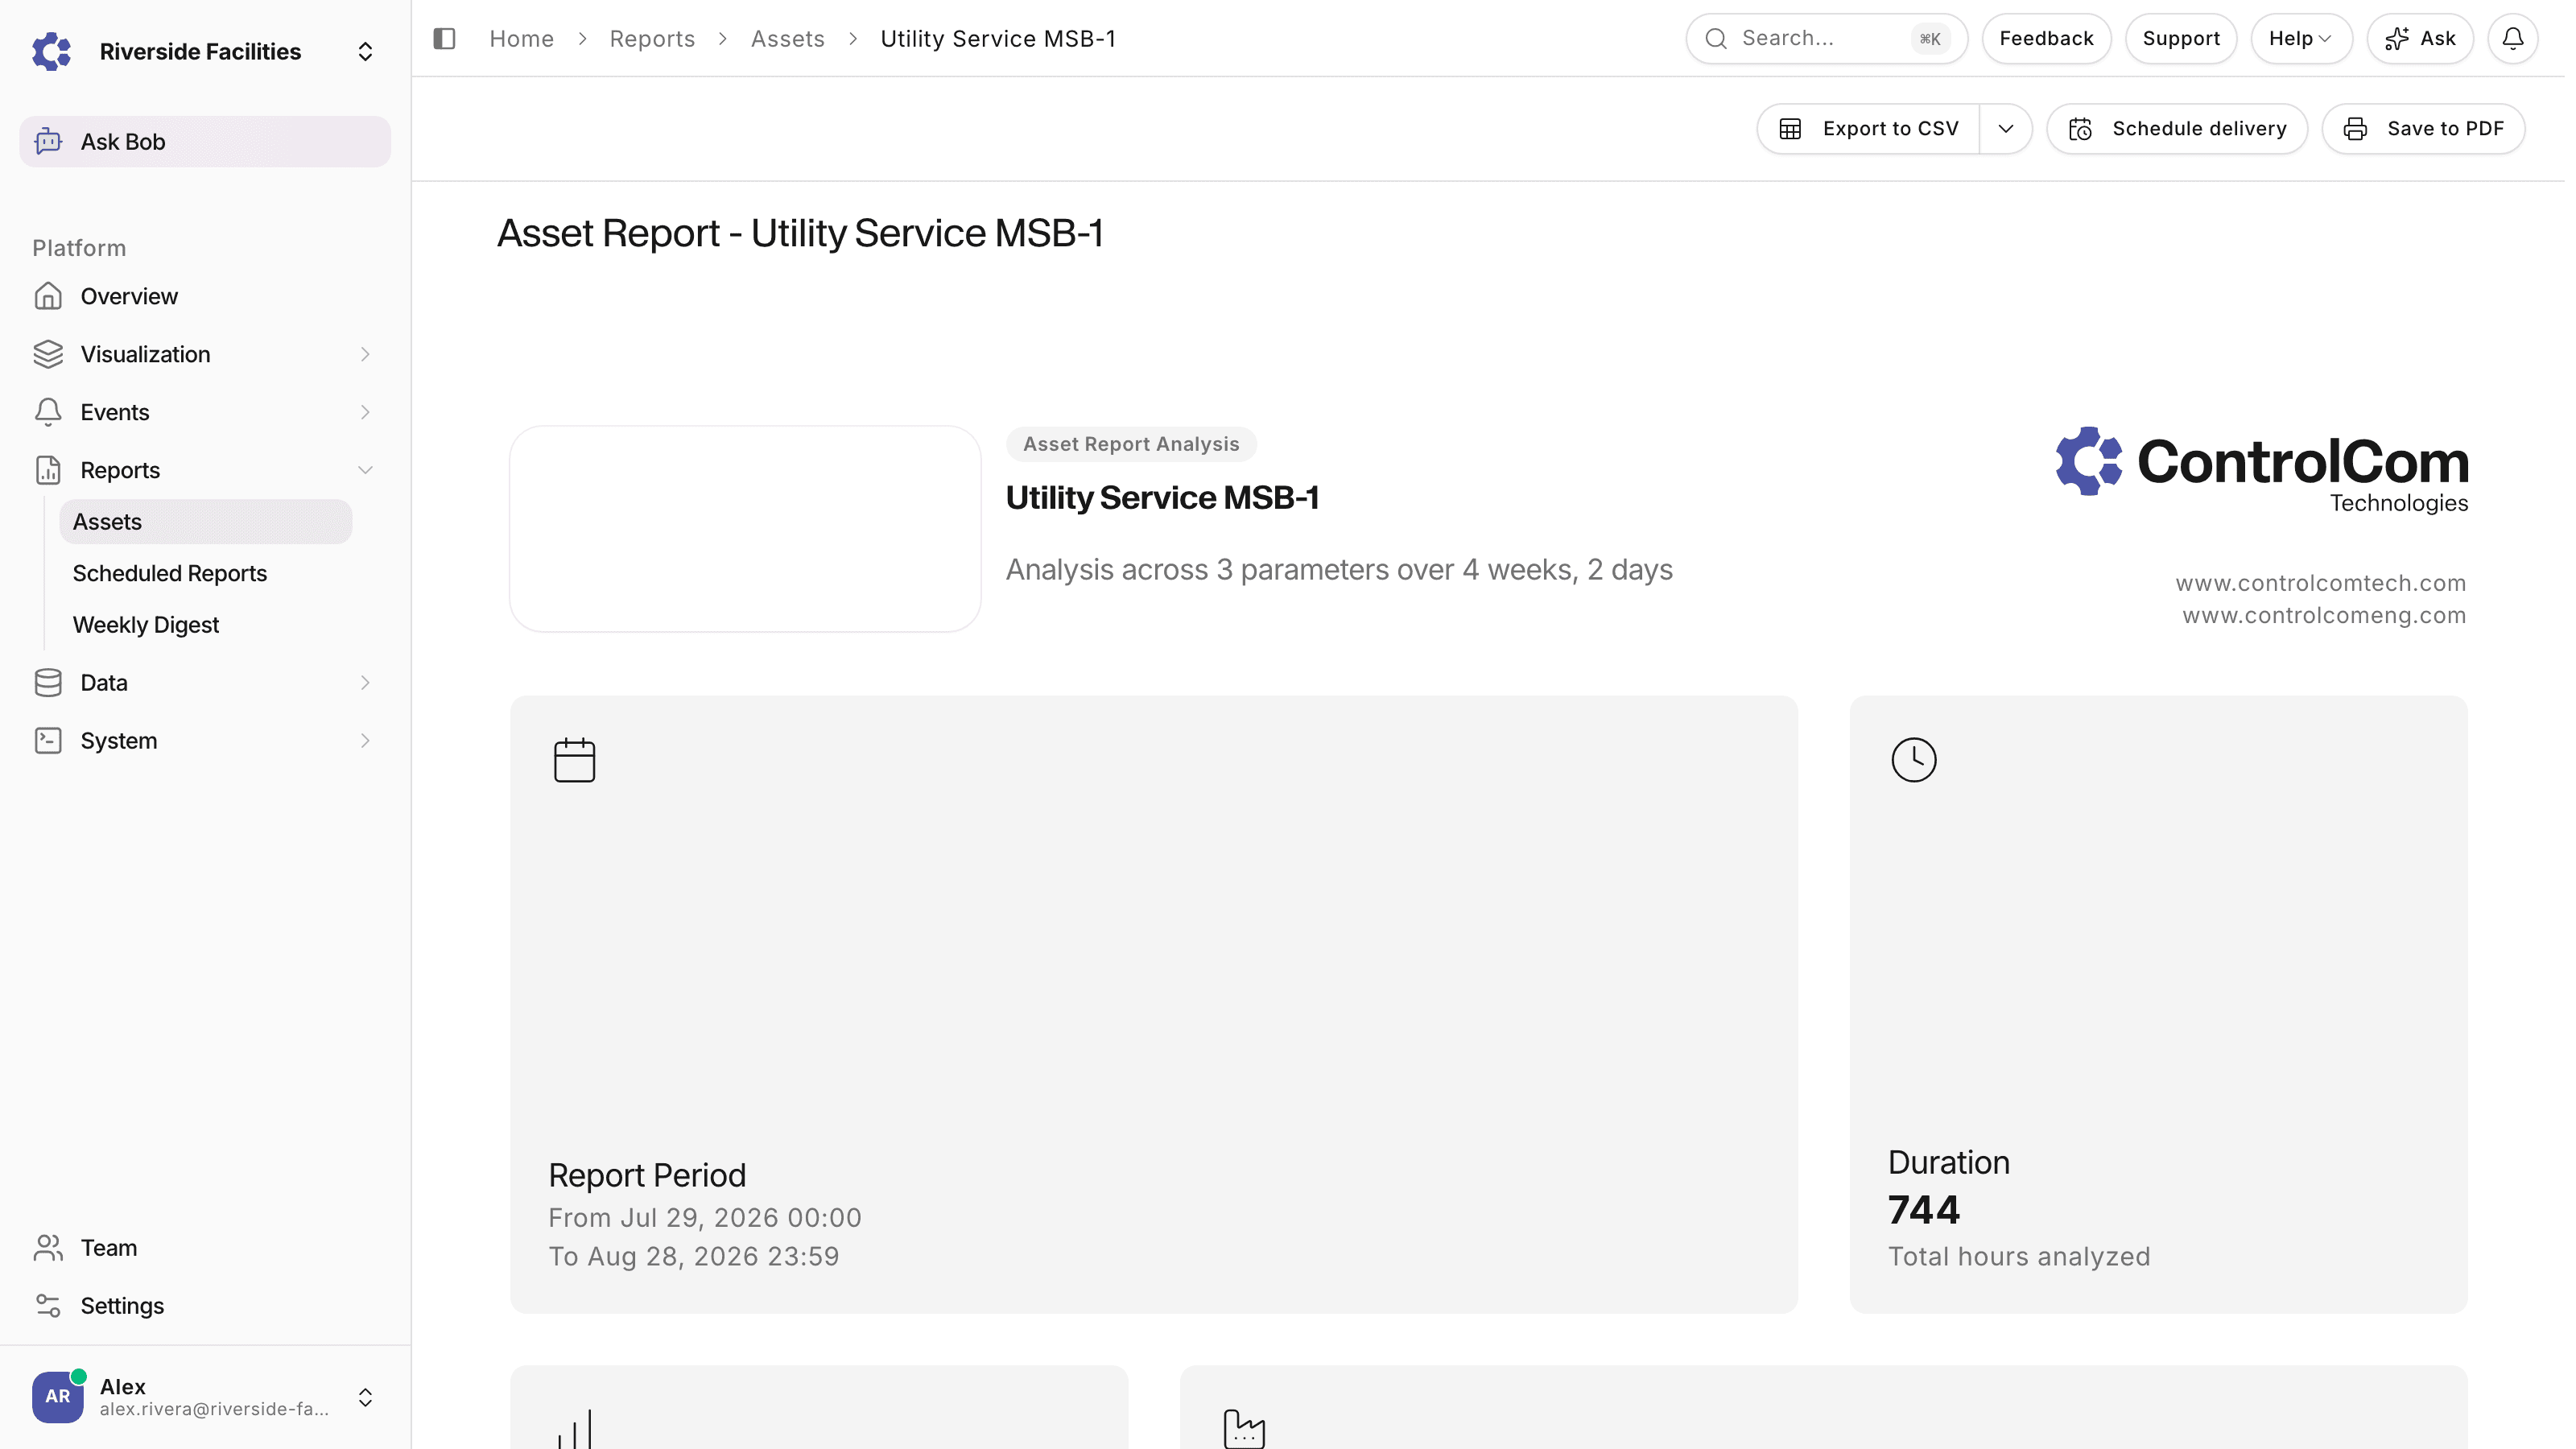
The Energy Management tools hold utility accounts, billing periods and uploaded bills, and report peak demand, energy use and load factor per utility company. Scheduled reports email asset data as a PDF on a recurring schedule, and usage analytics has surfaced savings opportunities of 15 percent and more. This is the same record the person who owns the buildings works from; the facility managers page shows it from that seat.
Load factor reports per utility company and billing period
Scheduled reports emailed as PDF on a recurring schedule
Tenant billing for the energy each tenant feeder records
The working rhythm
What the billing period looks like once it runs.
The cycle follows the utility calendar. Through the month, demand alarms watch the live variables and page the people who can shed load before an interval sets a new peak. When the bill arrives, it is uploaded against its account and billing period, and the Energy Management reports put the invoice next to the metered record: peak demand, energy use and load factor for the same dates. At the period boundary, an operator clears the stored peak by command so the next month starts its own record, and the scheduled PDF lands in the inboxes of everyone who owns a budget line. Nothing in that loop is compiled by hand.
During the period: demand alarms and load shedding while intervals are open
When the bill lands: invoice checked against the metered record for the same dates
At the boundary: stored peak cleared, scheduled reports delivered, next period begins
Key numbers
What energy monitoring moves
20%
Peak demand charge reduction available from load management acting on live demand data.
15%+
Energy savings opportunities surfaced by consumption analytics across monitored facilities.
24/7
Continuous metering with threshold alarms routed by SMS, email and push notification.
Days
From first connected meter to a live energy dashboard, using connectors the platform ships with.
Integration
Your meters, BMS and SCADA stay in place
Energy monitoring should start with the equipment already on the wall, not a rip-and-replace.
Protocols
Connect what is already installed
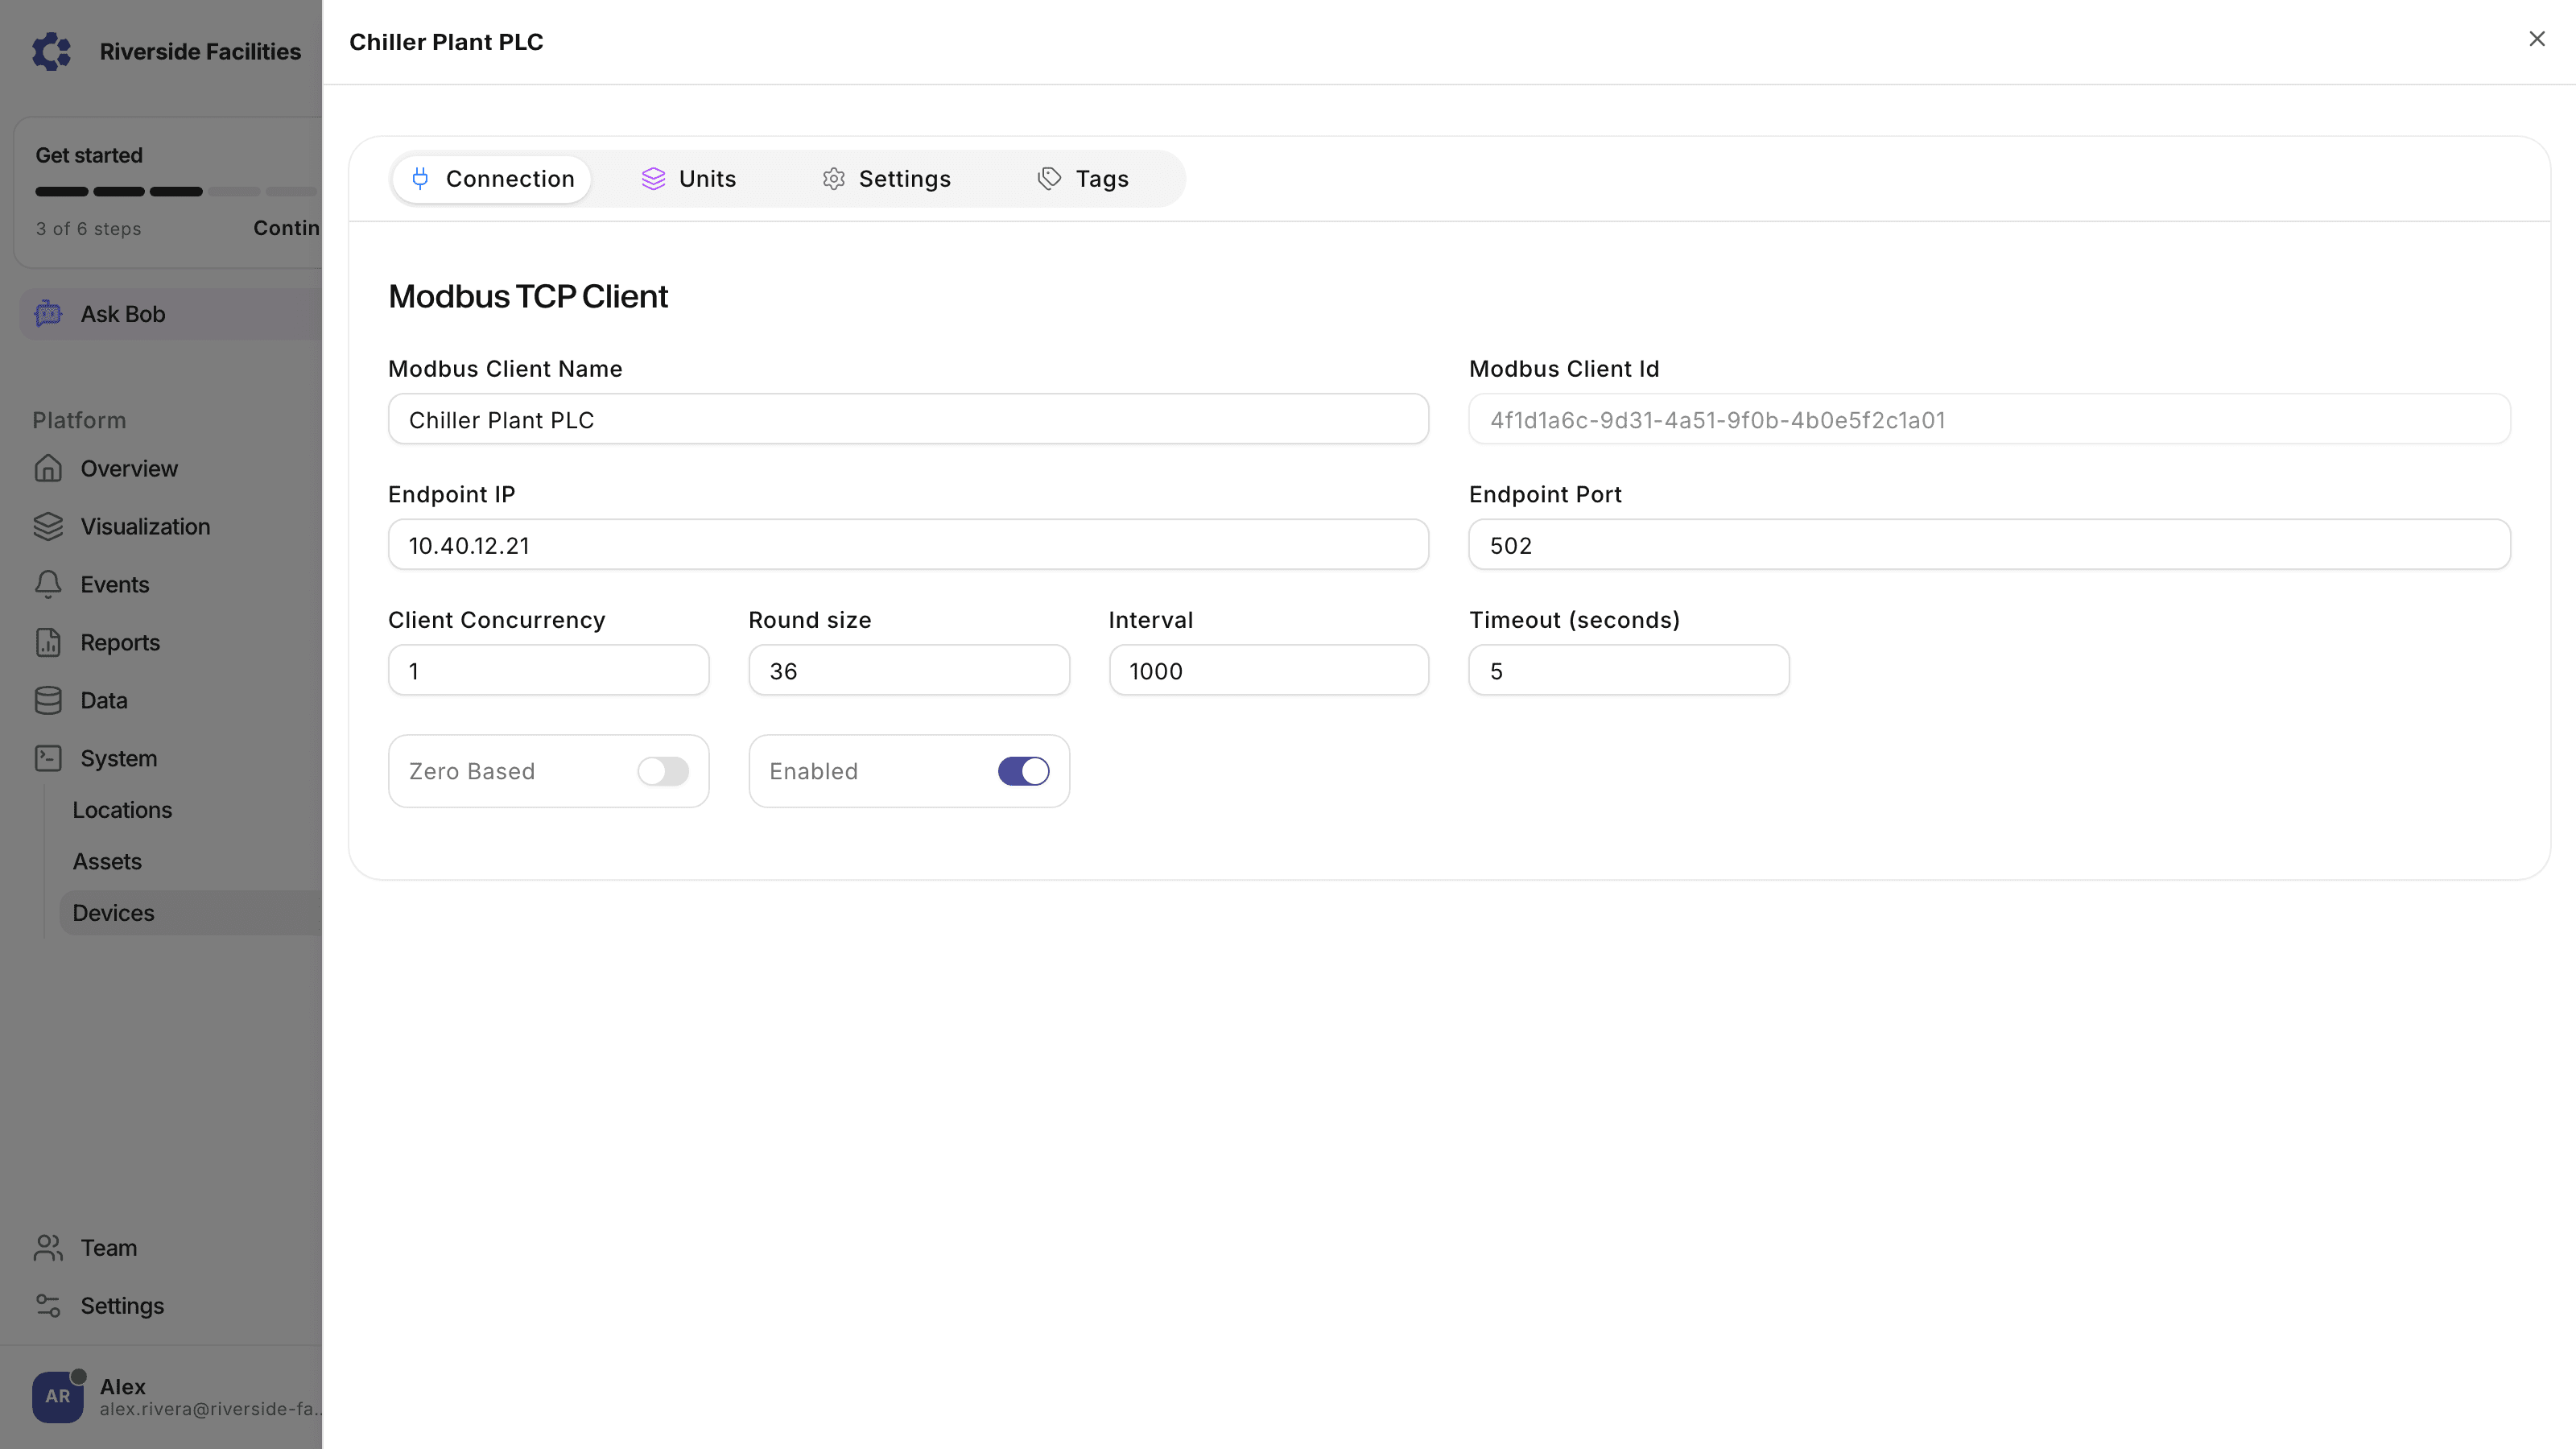
The ControlCom Edge Server runs as a container on hardware at your site and speaks Modbus TCP and RTU, OPC-UA, BACnet, EtherNet/IP and MQTT, so panel meters, power monitors, building systems and PLCs report without replacement. It buffers readings locally through a WAN outage, and existing BMS and SCADA keep their jobs.
Modbus TCP/RTU, OPC-UA, BACnet, EtherNet/IP, MQTT out of the box
Local buffering keeps metering intact through connection outages
No rip-and-replace: BMS and SCADA stay in service
FAQ
Energy management questions, answered
The questions buyers ask when evaluating ControlCom Connect.
Demand charges are set by the single highest interval in the billing period, so the saving comes from acting before the peak is locked in, not from reporting it afterwards. ControlCom Connect meters demand continuously through the on-site Edge Server, and an alarm on a demand variable notifies the people who can shed load by SMS, email or push notification while the interval is still open. Operators can then act from the same screen: commands write a new demand limit to the equipment, and clear a stored peak at the end of a billing period. The Energy Management reports close the loop by showing the peak demand actually recorded per utility company and billing period, so the team can see whether the discipline is holding month over month. Facilities that manage load this way have cut peak demand charges by up to 20 percent.
No. The Edge Server speaks Modbus TCP and RTU, OPC-UA, BACnet, EtherNet/IP and MQTT, so existing panel meters, power monitors, BMS controllers and PLCs report as they are, and adding a metered point is a client configuration rather than an electrical project. That is why a site can be metering into the platform in days: the demand and consumption values are already on the wire, and the work is mapping registers to named variables rather than pulling cable. Where a facility has no metering at all on a feeder it cares about, that gap has to be closed with hardware first. But everything already instrumented, including the BMS the buildings run on, stays exactly where it is and keeps its job while the platform reads alongside it. The result is that the metering project starts with configuration on day one, and hardware only where the portfolio genuinely has none.
Yes. Every site reports into one organization, so dashboards, alarms and reports cover the whole portfolio rather than one building at a time. The Map plots each location colored by its live alarm state, which makes the morning check a glance instead of a login per site. For comparison work, the Data Explorer plots the same measurement across sites on one chart, raw or aggregated per time bucket, with minimum, maximum and average available for each series and a CSV export of exactly what the chart shows. That is what turns multi-site metering into decisions: the building that drifts overnight, the feeder whose load never drops on weekends, and the site whose profile changed after a controls modification all show up as diverging lines rather than anecdotes, whether the portfolio is two facilities or fifty.
Yes. The Energy Management tools hold your utility accounts, their billing periods and the bills you upload against them, and report peak demand, energy use and load factor per utility company, so each invoice is checked against your own metered record rather than taken on trust. Billing errors and estimated reads surface as a mismatch between the bill and the platform's numbers for the same period. Load factor, the ratio of average demand to peak demand across the billing period, is the most useful screening number the reports produce: a site with a low load factor is paying demand charges out of proportion to the energy it actually uses, which points at short, sharp peaks that scheduling or equipment sequencing could flatten. Reviewing that one number per site, every billing period, is how a portfolio decides where the next demand-management effort goes.
The Edge Server at the site keeps collecting: it buffers readings locally through the outage and syncs the history when the connection returns, so the metered record stays complete. For energy work specifically, completeness is the point. Bill verification only stands up if the platform's record covers the same billing period as the invoice with no holes in it, and a load factor computed over a gappy month is a guess rather than evidence. Local buffering is what protects that, and it runs on the same gateway doing the metering, so there is no separate data logger to maintain. Remote dashboards do go dark for the affected site until the link returns, but nothing is lost, and the demand story for the outage window backfills as soon as the site reconnects.
Yes, from the same stored readings. An asset data report trends the variables of one asset over a chosen period, with aggregation buckets from 10 minutes to 1 day, grouping by unit or classification, optional weather correlation for the asset's location, and a Data Insights section that flags variability, outliers, trends and data quality concerns. Export to CSV downloads the raw readings flat or pivoted, and Save to PDF produces the document version of the same study. Schedule delivery carries the configuration into a recurring job that emails the PDF hourly, daily, weekly or monthly to any recipient list, with a run history kept per job, and a weekly digest recaps the organization every Monday. Sustainability reporting draws on the same record: consumption and efficiency metrics come from the stored series, over whatever period the reporting framework asks for.
Keep exploring
Adjacent pages for the people who own the utility bill and the equipment behind it.