Vendor-neutral OEE software for mixed-vendor plants
Track availability, performance, and quality across every line, no matter whose PLC runs it. ControlCom Connect turns Allen-Bradley, Siemens, Mitsubishi, and legacy controllers into one OEE dashboard, without ripping out what you already own.
Works with any PLCDeploys in daysNo per-tag licensing
The status quo
Why production monitoring stalls on the plant floor
Most plants run equipment from a dozen vendors bought over thirty years. The OEE stack is usually built for exactly one of them.
01
01 / Vendor pain
OEE tools assume a single-vendor plant
FactoryTalk is built Allen-Bradley first; the further your floor gets from a pure Logix shop, the more friction you hit. Real plants mix Allen-Bradley, Siemens, Mitsubishi, ABB, and controllers older than the engineers running them. A single-vendor OEE tool leaves half the floor dark.
02
02 / Downtime pain
Downtime reasons live in operators heads, not data
When a line stops, the reason gets written on a clipboard or lost entirely. Without automated downtime capture tied to live machine state, the Pareto of what is actually costing you uptime is a guess, and the morning meeting argues about anecdotes instead of numbers.
03
03 / Visibility pain
No rollup across lines, shifts, or plants
Each line has its own HMI and its own spreadsheet. There is no portfolio view of OEE by line, shift, product, or site, so benchmarking one cell against another, or one plant against the network, means exporting CSVs and stitching them by hand.
04
04 / Time-to-value pain
Traditional MES projects take quarters to show a number
Classic MES and historian rollouts are capital projects measured in quarters and integrator hours. By the time the first OEE chart appears, the line has changed. Plants need a working number in the same week the project starts, not after a six-month integration.
Production teams
One OEE dashboard for every line you run
The same platform that connects the machines is the one operators, supervisors, and plant managers use to run the floor.
ControlCom Connect delivers OEE software that works across the equipment you already own. Pre-built connectors for Modbus TCP/RTU, OPC-UA, EtherNet/IP, and MQTT pull live state, counts, and faults off Allen-Bradley, Siemens, Mitsubishi, ABB, and legacy controllers, then compute availability, performance, and quality into a single OEE number per line, per shift, per product. Automated downtime capture, real-time production monitoring, and audit-ready reporting, all from one cloud dashboard.
Most plants lose 30 to 50 percent of potential output to downtime, micro-stops, and quality losses they cannot see in time to act. The cause is rarely the equipment; it is the visibility. A historian that does not reach half the lines, an HMI per cell with no rollup, and downtime reasons that never make it into data. ControlCom Connect collapses that into one pane of glass, so the gap between a line stopping and someone knowing why is measured in seconds.
Multi-plant manufacturers get a fleet view on day one: OEE rolled up by line, shift, product, plant, or region, with the worst performers surfaced automatically. The same data that runs the daily standup runs the quarterly review, the equipment performance program, and the continuous-improvement work. Plants that run cook, chill, and cold-storage steps alongside production extend the same platform through food and beverage monitoring, and the energy side of the plant reports from the same data set. Pre-built protocol connectors and a containerized edge agent mean a line is producing an OEE number within days, not after a multi-quarter MES rollout.
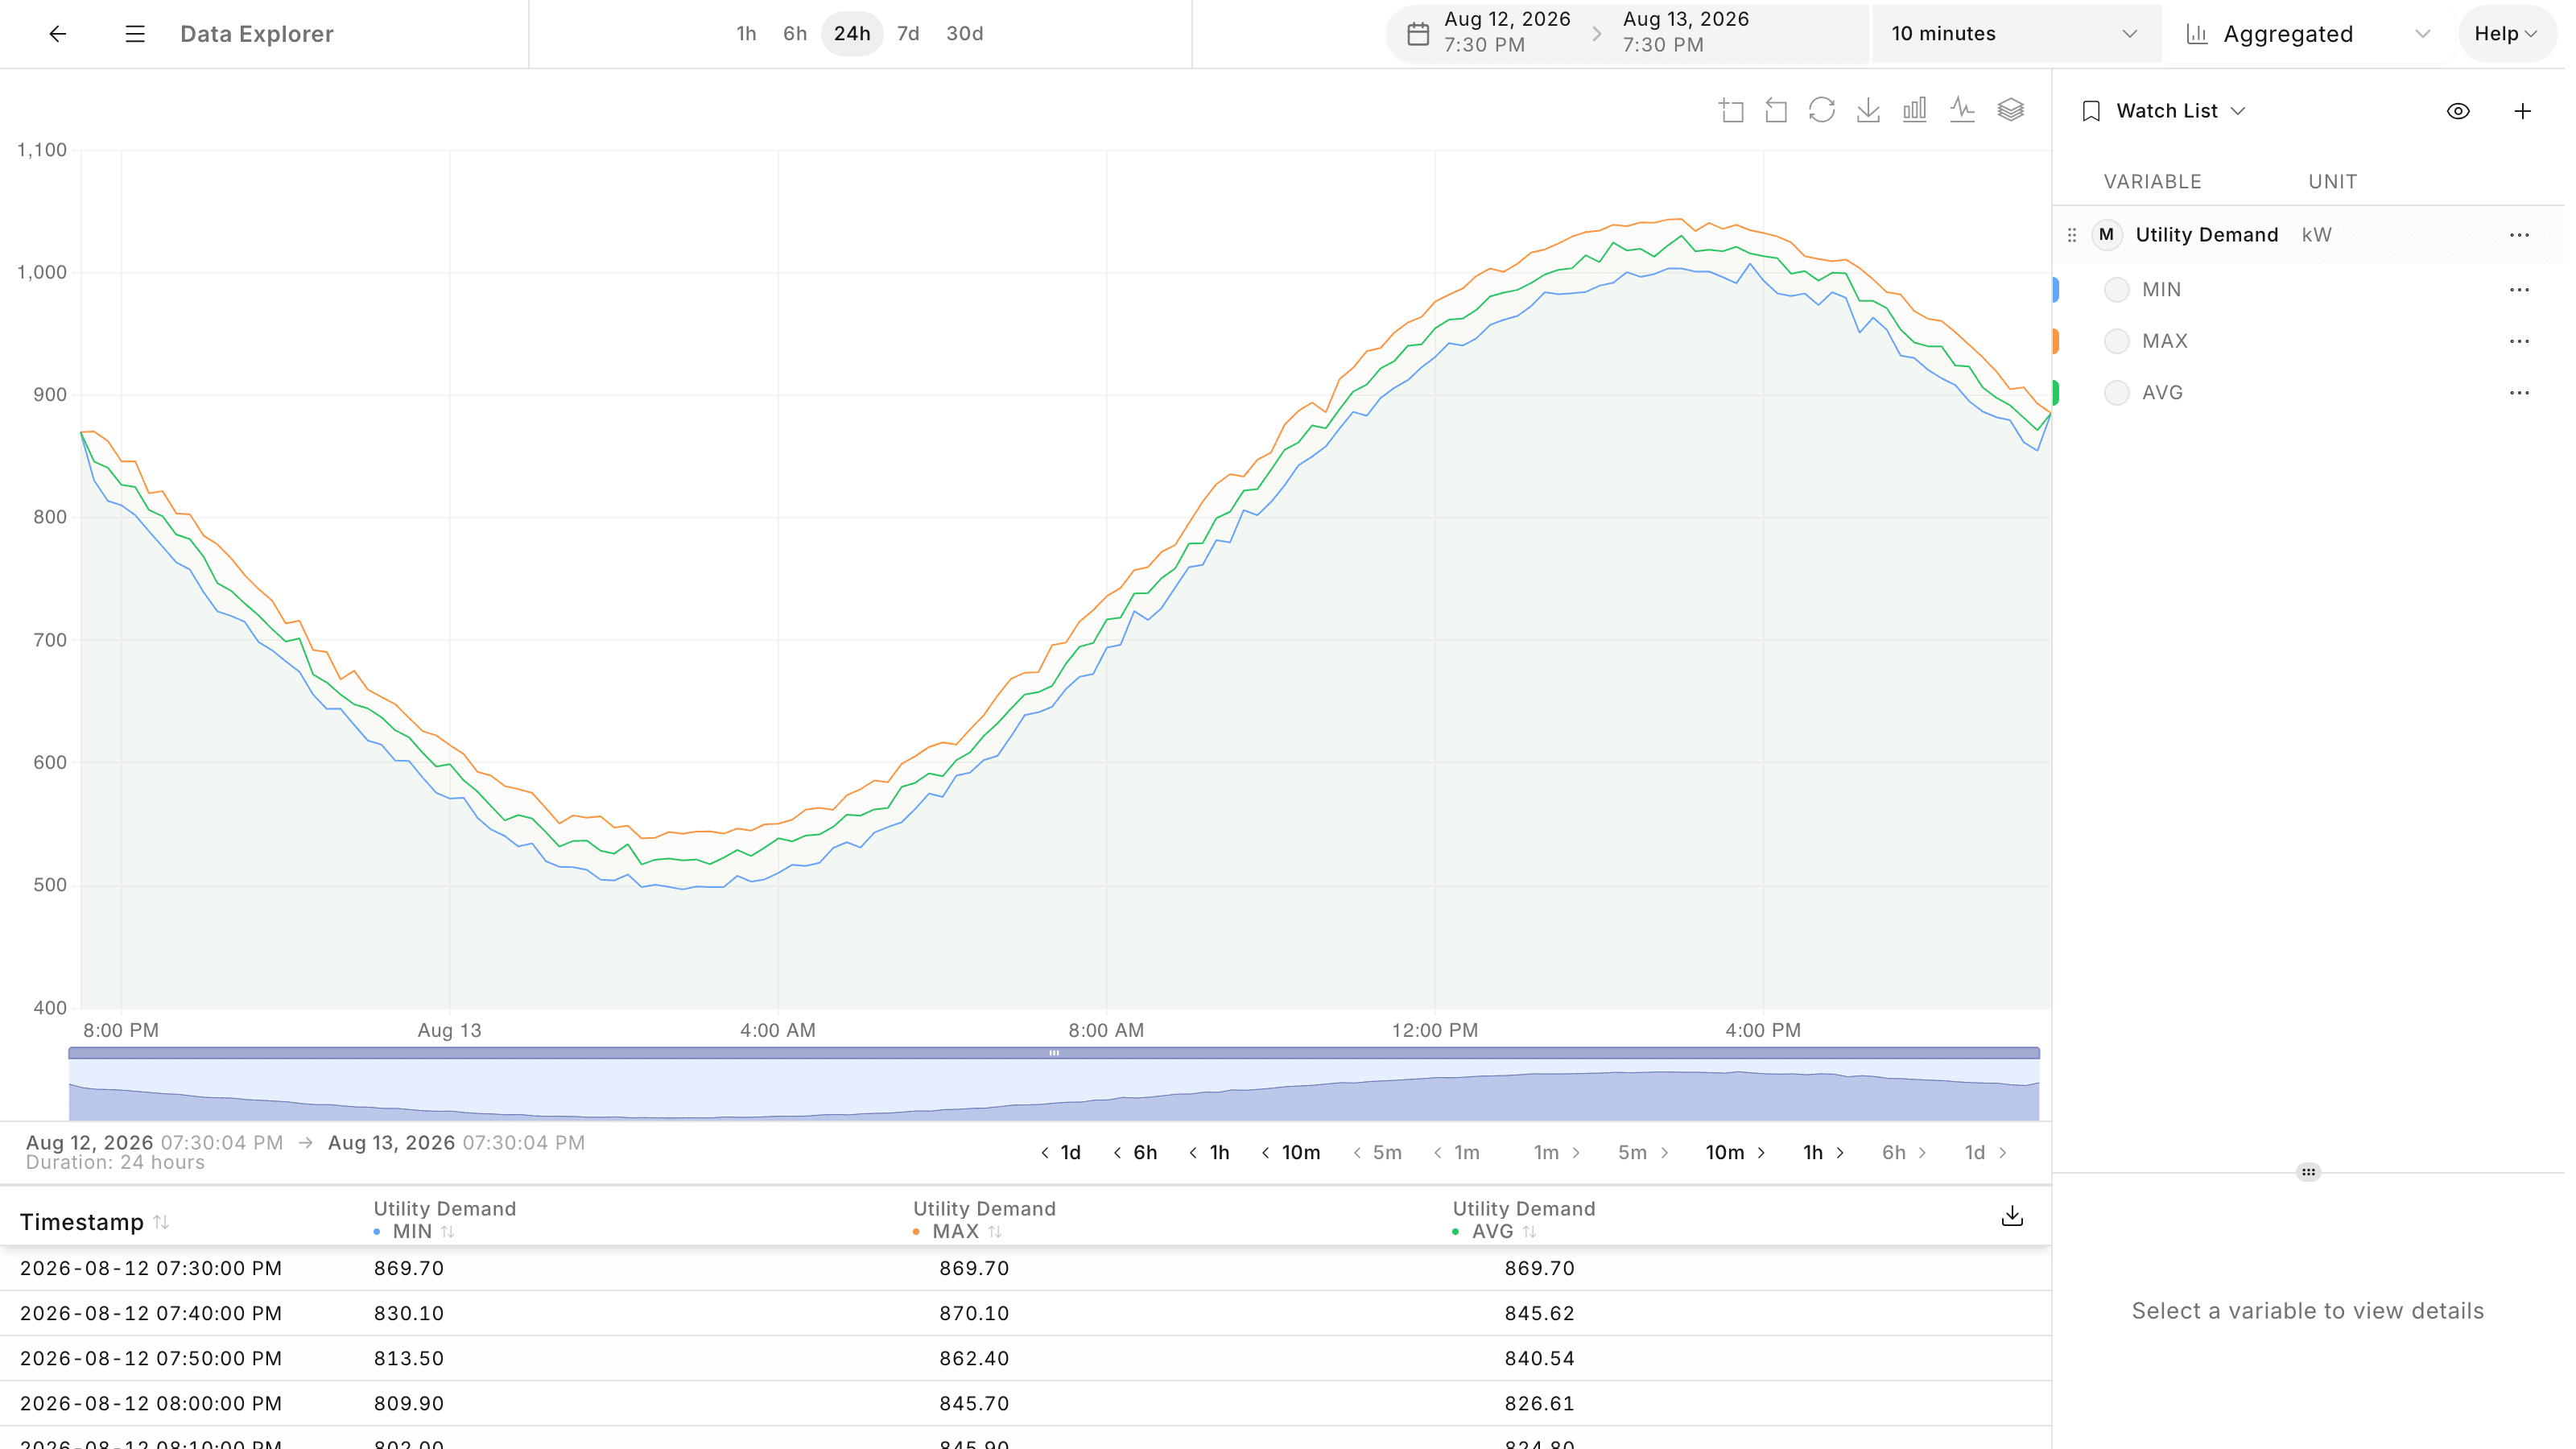
Explorer, comparing line variables over the shift window that matters.
Automated availability, performance, and quality
Downtime reason capture tied to live machine state
OEE rollup by line, shift, product, and plant
Works with Allen-Bradley, Siemens, Mitsubishi, and legacy PLCs
What's in the platform
Built for OEE and production monitoring at plant scale
The features that move OEE on a real, mixed-vendor floor, pulled from the same platform that connects the machines.
01
Real-time OEE: availability, performance, quality
Live OEE per line, cell, and asset, broken into its availability, performance, and quality components. Compare against takt and ideal cycle time, track first-pass yield, and see the single number trend by shift, product, or crew without exporting anything.
02
Vendor-neutral PLC and machine connectivity
Pre-built connectors for Modbus TCP/RTU, OPC-UA, EtherNet/IP, BACnet, and MQTT bring Allen-Bradley, Siemens, Mitsubishi, ABB, and legacy controllers into one platform. No rip-and-replace, no Allen-Bradley tax, no second-class treatment for non-Logix lines.
03
Automated downtime capture and Pareto
Downtime is detected from live machine state, not a clipboard. Reasons are captured, categorized, and rolled into a Pareto so the morning meeting argues from data. Micro-stops and slow cycles that hide inside performance loss finally show up where you can act on them.
04
Multi-line and multi-plant fleet rollup
A single portfolio view across every line, cell, shift, and site. Roll up OEE by product family, plant, or region, and benchmark the network against itself. The worst performers surface automatically instead of waiting for a monthly report.
Counts, rates, cycle times, and quality data are logged continuously with full history. Anomaly detection surfaces drifting cycle times and developing quality issues before they become scrap, and any dashboard exports as a PDF for any historical date range.
Native iOS and Android apps with per-user notification routing and SMS, email, and push delivery. A supervisor sees the line down on a phone on the floor at 2am, the same single pane of glass they use on a workstation at 9am.
Key metrics
The numbers production monitoring actually moves
OEE, downtime, time-to-detect, and time-to-value. The four numbers a plant manager is measured on.
OEE
Single source of truth
Availability, performance, and quality computed live across every line, not estimated after the shift.
MTTD
Mean time to detect
Automated downtime capture closes the gap between a line stopping and someone knowing why.
30-50%
Hidden loss exposed
Micro-stops, slow cycles, and quality losses that single-vendor tools miss on mixed-vendor floors.
Days
Time to first OEE number
Pre-built connectors and a containerized edge agent, not a multi-quarter MES rollout.
Keep exploring
Adjacent pages for plant managers, controls engineers, and operations leaders.
Common questions from plant managers, controls engineers, and continuous-improvement teams evaluating ControlCom Connect.
Yes, that is the entire point. ControlCom Connect is vendor-neutral by design: pre-built connectors for Modbus TCP/RTU, OPC-UA, EtherNet/IP, BACnet, and MQTT treat Allen-Bradley, Siemens, Mitsubishi, ABB, and legacy controllers as equals, so a mixed-vendor floor lands in one OEE dashboard without a rip-and-replace project. That matters because real plants are mixed by history, not by choice: lines bought over thirty years, machines that arrived with their builder's preferred PLC, and acquisitions that brought a different standard with them. Single-vendor OEE tools handle their own family well and leave the rest of the floor dark or expensively bridged. Here, the Siemens line and the Logix line produce the same availability, performance, and quality numbers from the same computation, so cross-line comparison is honest. For controllers that need custom handling, the Edge SDK onboards new device types visually without writing code.
OEE is computed live from machine data as Availability x Performance x Quality. Availability comes from run/stop state and automated downtime capture, so planned and unplanned stops are separated and every minute of the shift is accounted for. Performance compares the actual production rate against ideal cycle time or takt, which is where micro-stops and slow cycles show up even when the line never technically stopped. Quality tracks good versus total counts and first-pass yield from the same counters the machines already report. Every component is visible and auditable rather than a black-box number: click into a shift's OEE and see the downtime events, the cycle-time distribution, and the counts behind it. The number is computed per line, cell, shift, product, and crew, so the morning meeting compares like against like instead of arguing about whose line had the harder product mix.
Downtime events are detected from live machine state, not from a clipboard, so the event exists the moment the line stops, with its true start time and duration. Reasons are then categorized and rolled into a Pareto: operators can confirm or annotate the reason from an HMI or a mobile device, but the capture itself does not depend on anyone remembering to write it down. The practical difference shows up in the short events. A four-minute jam that clears itself never makes it onto paper, and thirty of them a week quietly cost more than the one big breakdown everyone remembers, but they all land in the data here. Because the events carry timestamps and machine state, the Pareto separates the chronic micro-stops from the rare long stops, which usually changes where the maintenance and engineering effort actually goes.
No. ControlCom Connect is designed to sit on top of what you already run. Many plants keep their MES for scheduling, traceability, and work orders, keep an existing historian where one exists, and use ControlCom for cross-line OEE, automated downtime analytics, multi-plant rollup, and mobile access, especially on the lines their existing systems never reached. The platform reads directly from the PLCs over Modbus TCP/RTU, OPC-UA, EtherNet/IP, and MQTT, so it does not compete for the MES integration points or require the historian to be re-architected. Data flows one way into the monitoring layer, and the control layer is untouched. Over time some plants consolidate onto the platform for the visibility functions, but that is a choice made after the value is proven, not a migration you have to commit to on day one to get the first OEE number.
Days, not quarters. A containerized edge agent drops on a small box at the line, makes outbound-only connections so nothing is opened inbound on the OT network, and pre-built protocol connectors pull live state, counts, and faults from the PLCs, in most cases the same day. A working OEE dashboard with automated downtime capture is typically live within the same week the project starts. The remaining effort is calibration rather than integration: setting ideal cycle times or takt per product, agreeing the downtime reason categories with the operators who will confirm them, and wiring the alarm routing for supervisors and on-call staff. Most plants start with one line, usually the one with the worst unexplained losses, prove the number against what the team believes is true, then roll out line by line with each new line inheriting the configuration patterns of the first.
Yes. Multi-plant fleet visibility is a default feature, not a custom build. Every line, cell, and site registers into one asset hierarchy, and OEE, downtime, and production roll up by line, shift, product, plant, or region in one dashboard, with the worst performers surfaced automatically instead of waiting for the monthly report. Benchmarking across the network works because every plant computes OEE the same way from the same machine-state definitions, so the comparison between one plant and another is finally apples to apples. Corporate continuous-improvement teams use the rollup to find which plant has solved a problem the others still have, and to check whether an improvement survived after the project team moved on. Any view exports as a PDF for any date range, so the quarterly review pack builds itself from the same data the daily standup uses.
Get started
Pilot OEE software on one line
Pick a line, any vendor, any vintage. We run the pilot. You see live OEE, automated downtime, and production analytics within days, not months. No credit card, no commitment.