The measurement loopHow a reliability team actually keeps score.
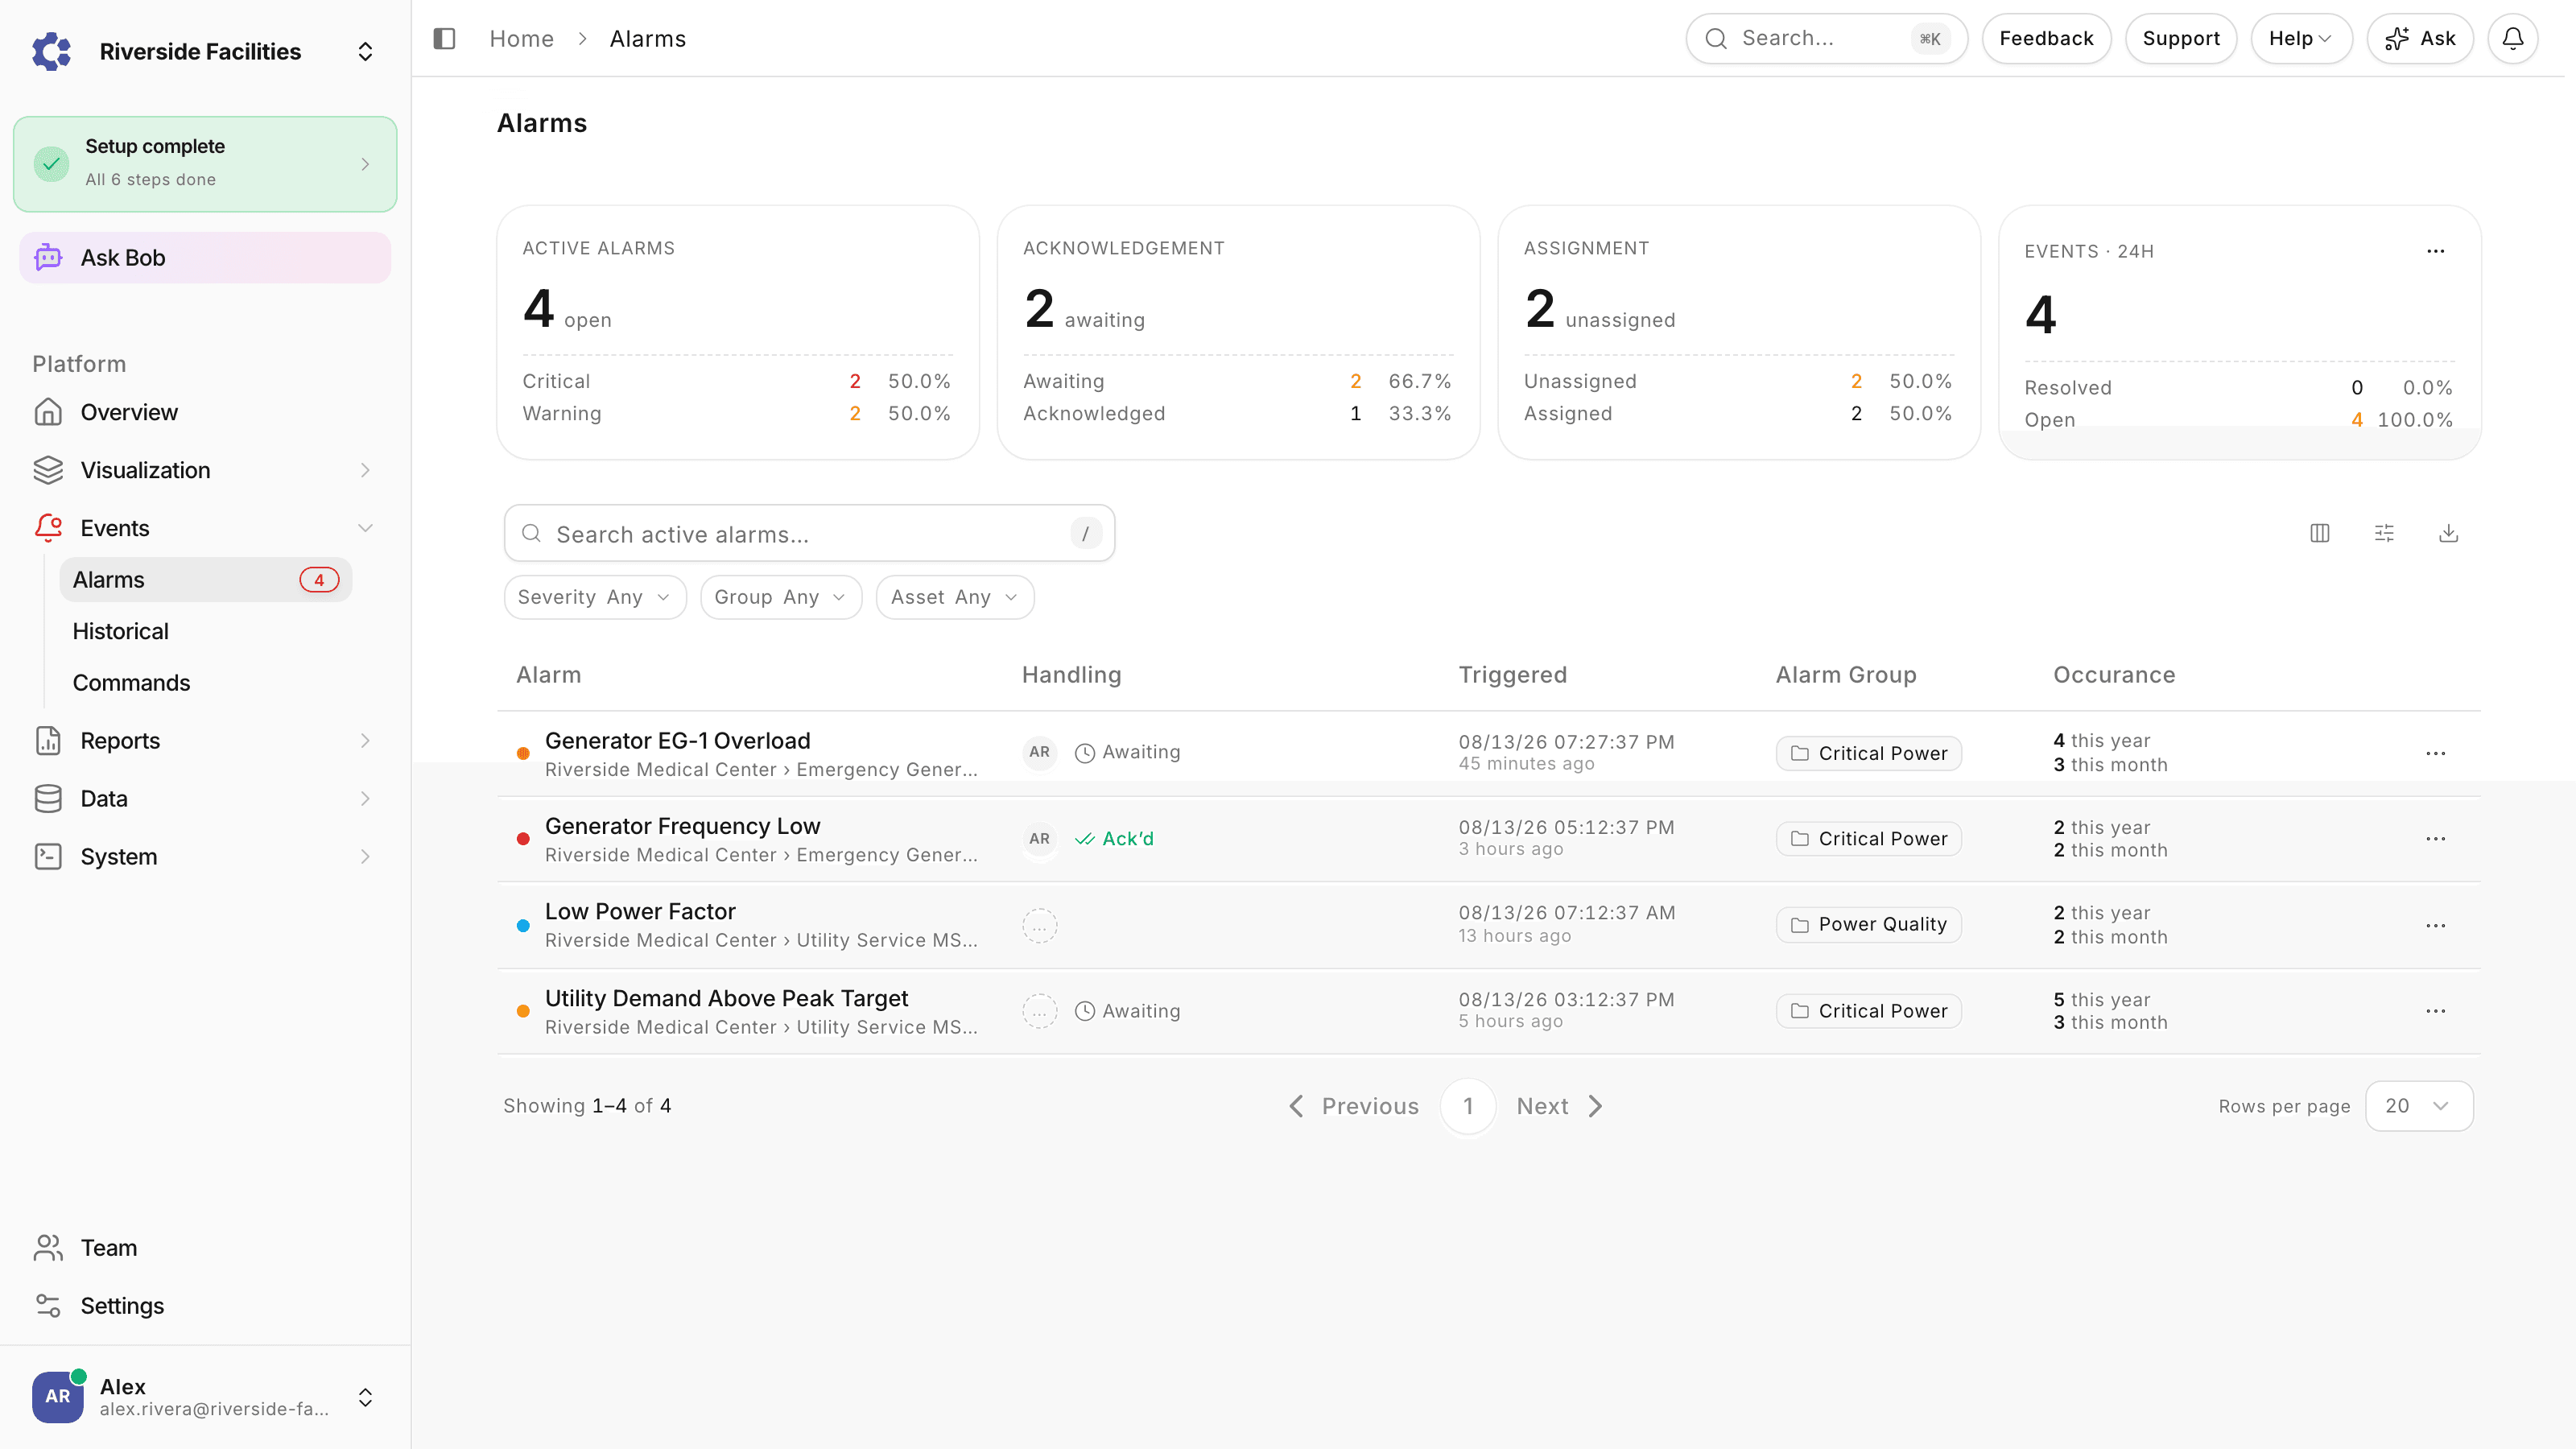
Three numbers carry the program, and the platform produces all of them without manual compilation. Occurrence counts on the Alarms page show how often each alarm has fired this year and this month, which is the trend line for whether a machine is getting better or worse. Anomaly events carry a z-score against the variable's own baseline, with the baseline mean and deviation included in the CSV export, so a flagged reading is defensible in a review rather than a hunch. And the asset data report closes each period: its Data Insights section flags variability, outliers, trends and data quality concerns per variable, and Schedule delivery emails it to the maintenance planner on the cadence the planning meeting runs on. When those three numbers drive the PM calendar, the outcome has moved from monitoring to management.
- Occurrence counts per alarm, per year and per month, as the health trend line
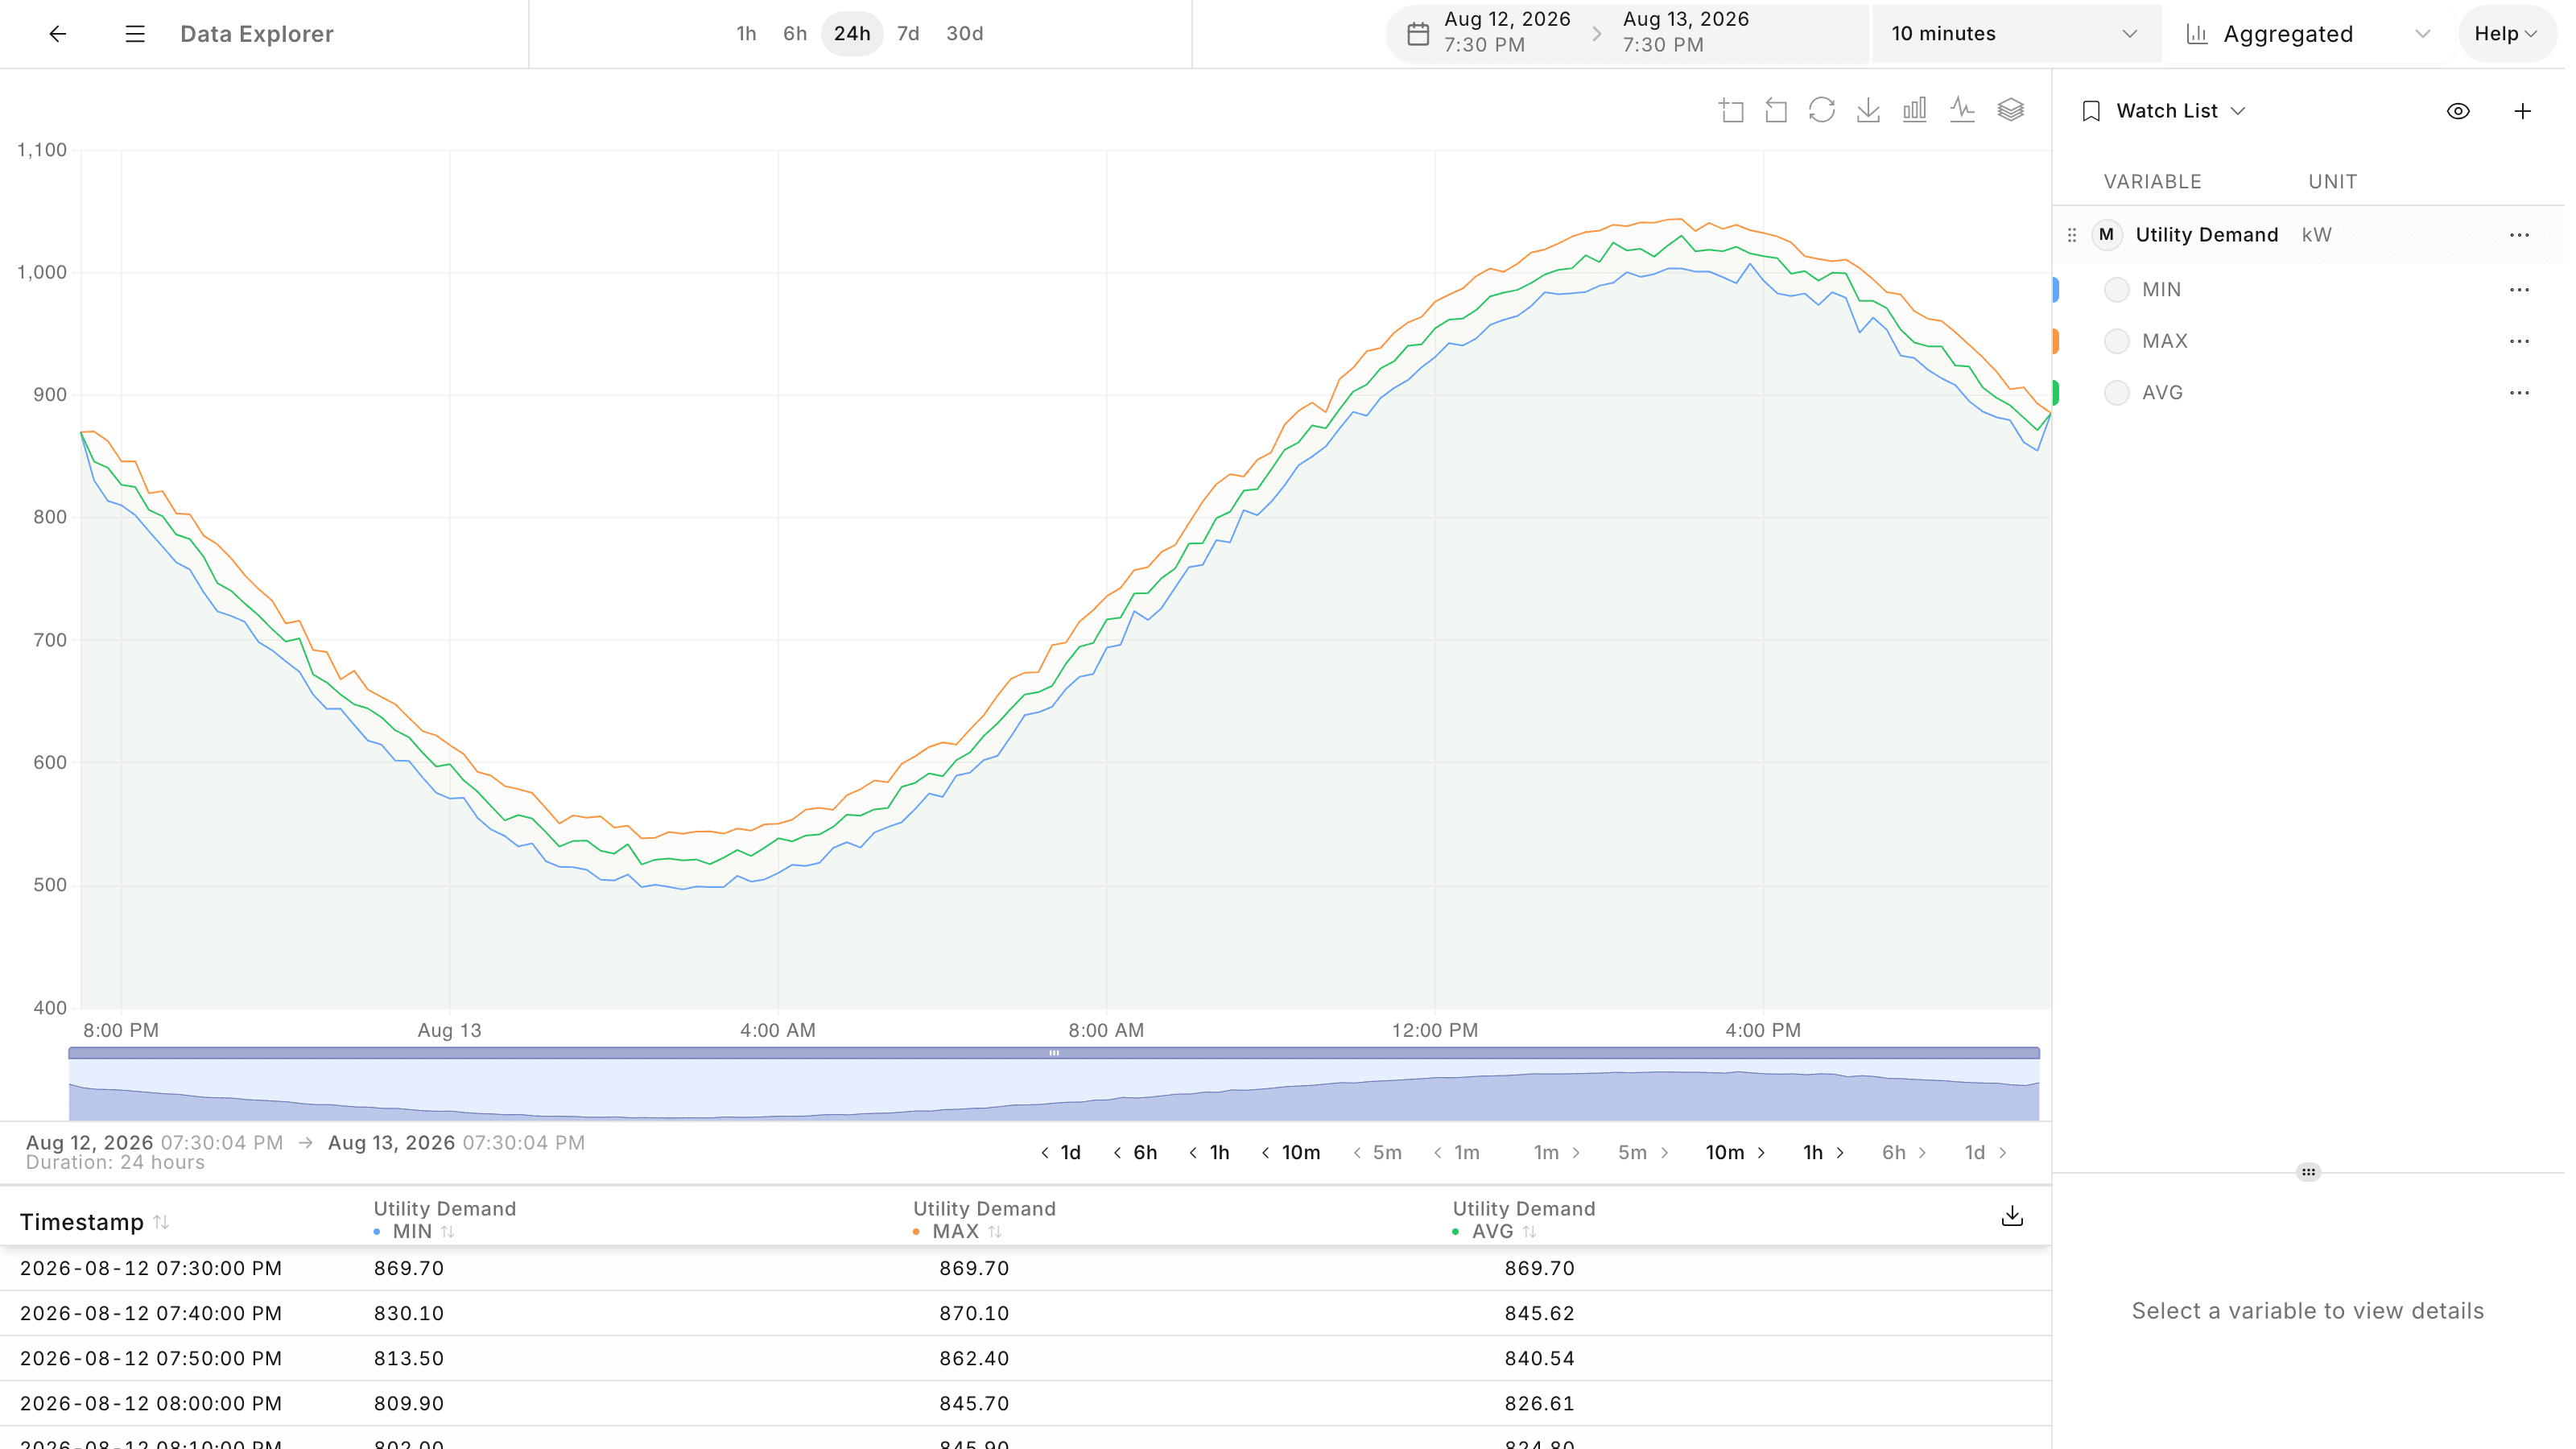
- Anomaly scores with baselines exported alongside the readings that earned them
- Data Insights per report period, delivered to the planner on a schedule