A login for every building
Every vendor system ships its own portal, so a morning check of the portfolio means a dozen logins, and comparing buildings means exporting readings into a spreadsheet that is stale before it is finished.
Facility management software is the layer above the building systems: it collects readings from HVAC plants, generators, electrical meters, refrigeration and water systems across every building you run, and puts them in one place, so checking the portfolio no longer means logging into a separate vendor portal for each site.
ControlCom Connect is that layer for multi-site portfolios. A ControlCom Edge Server at each building reads the equipment over the protocols it already speaks, and the hosted platform turns those readings into live dashboards, a map of every location colored by alarm state, threshold alarms that notify staff by SMS, email and push, and PDF reports emailed on a schedule.
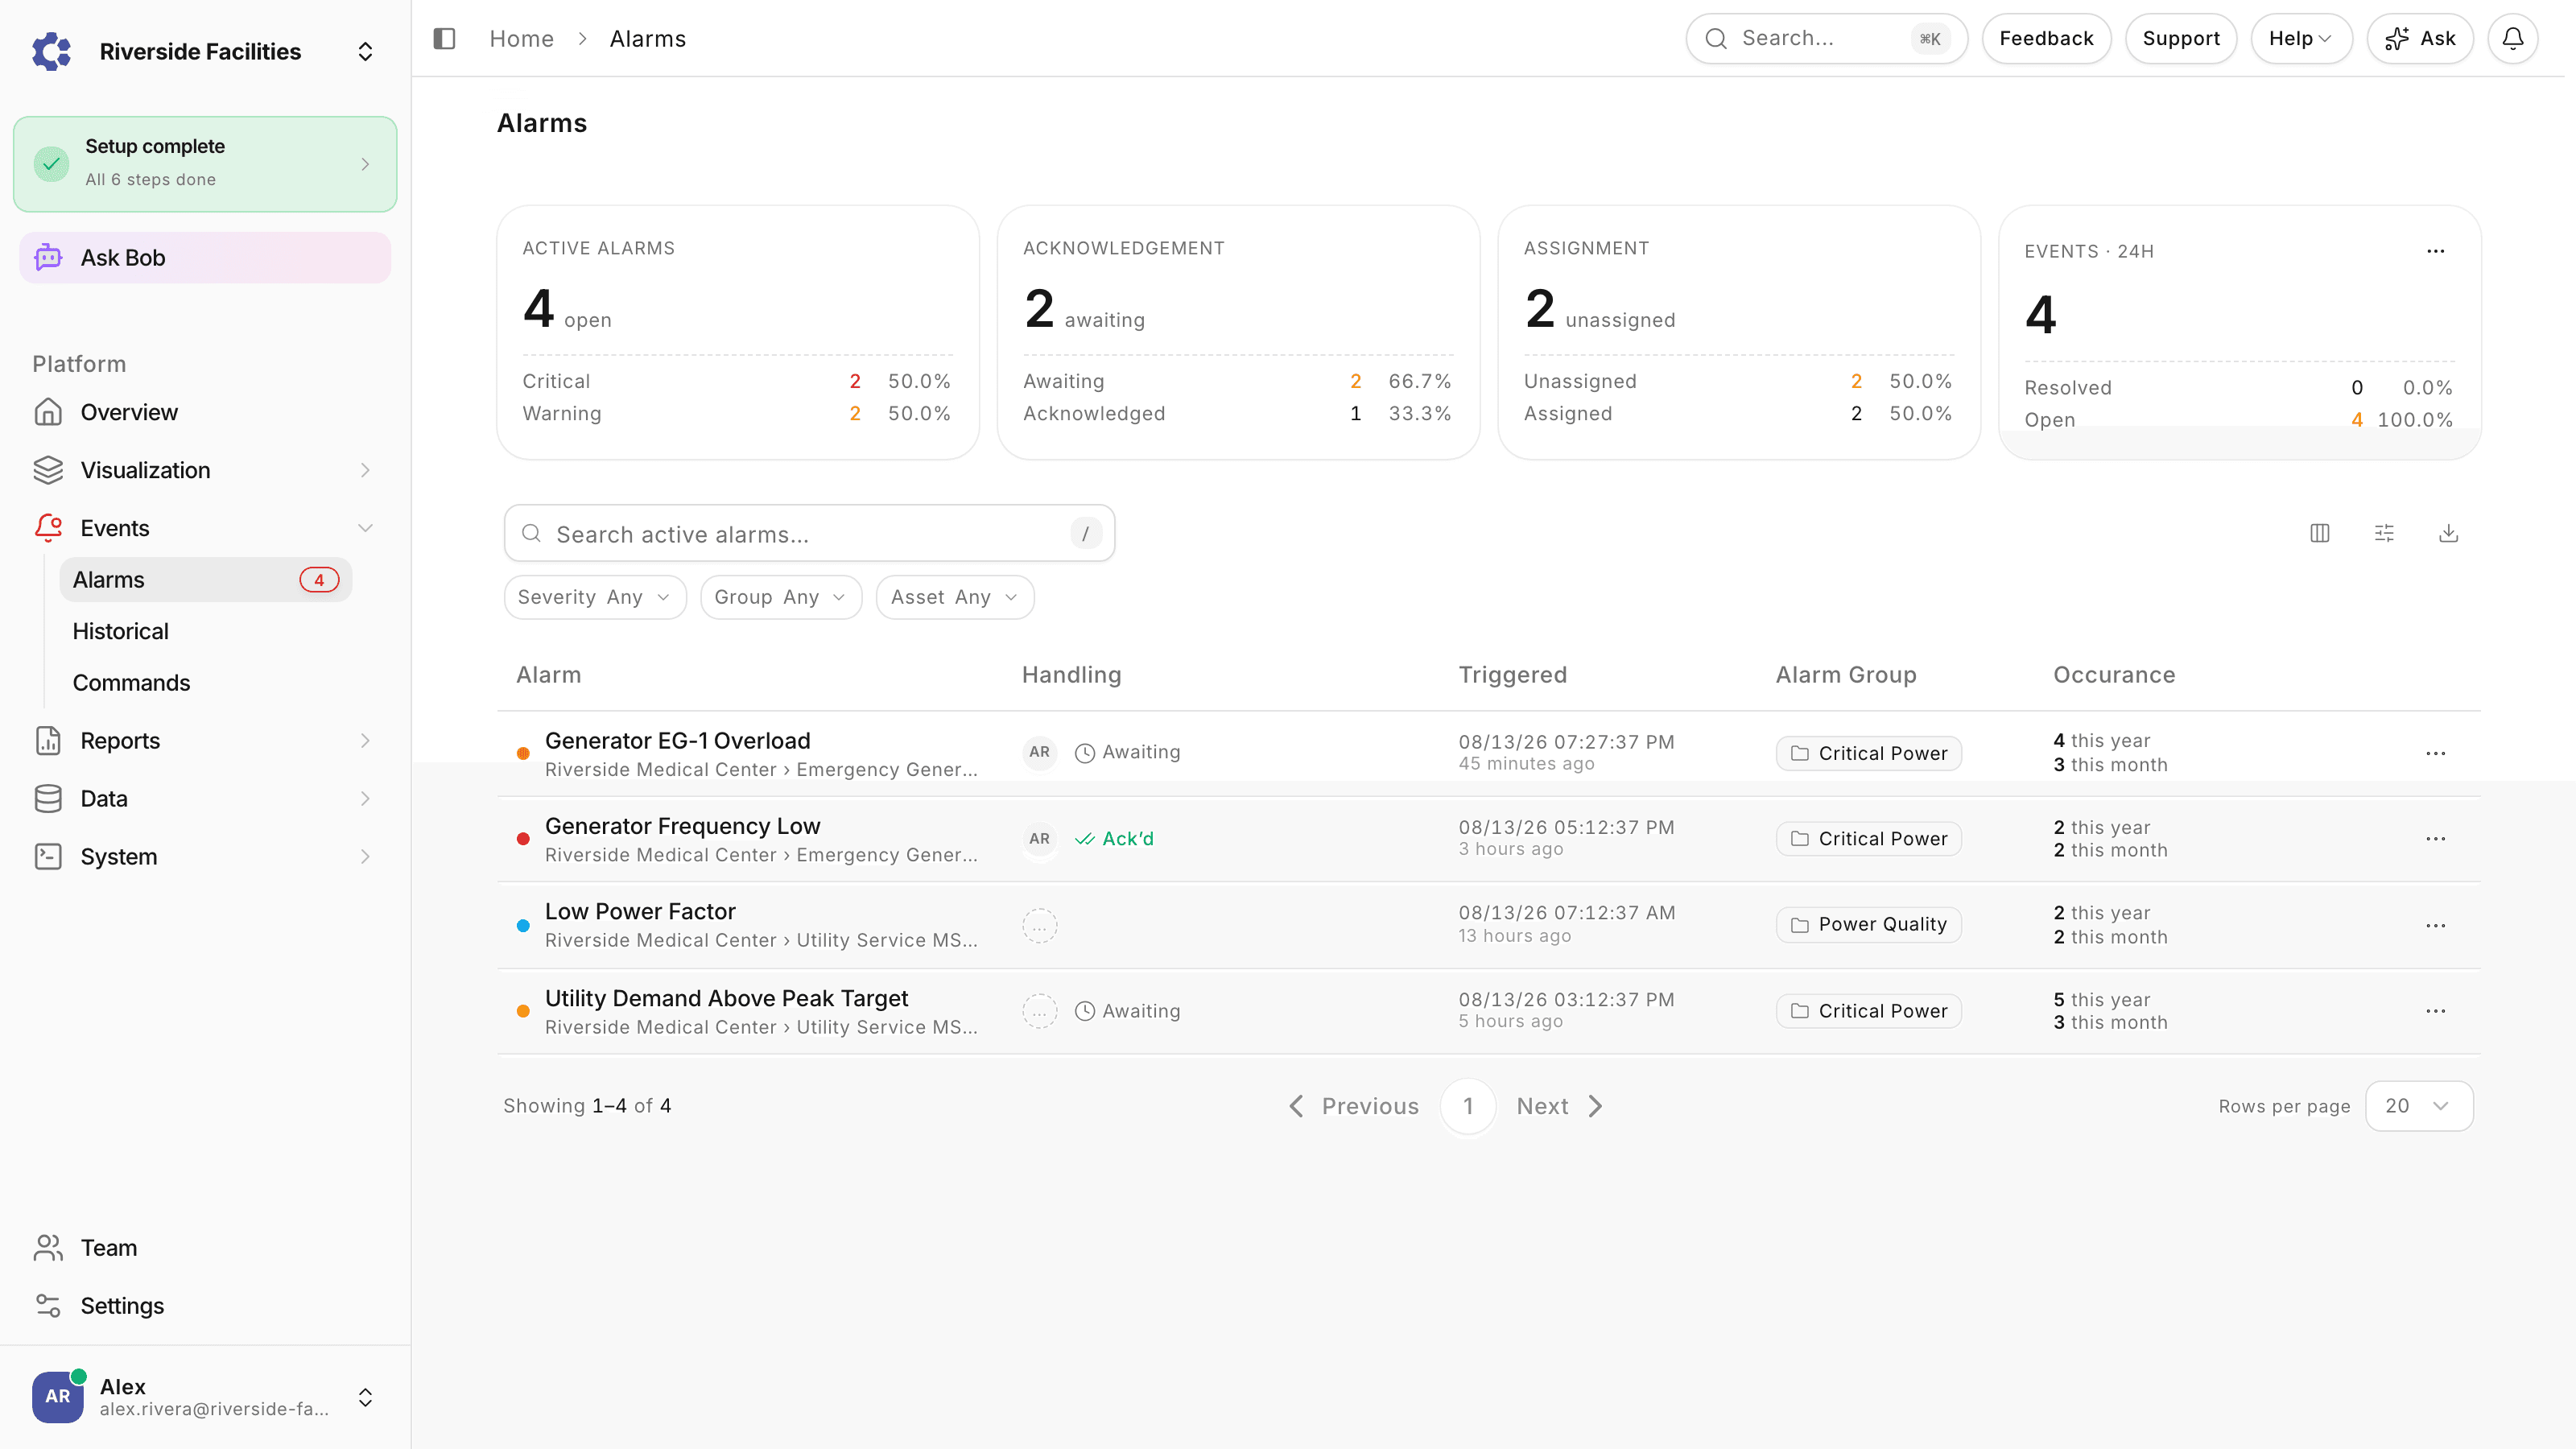
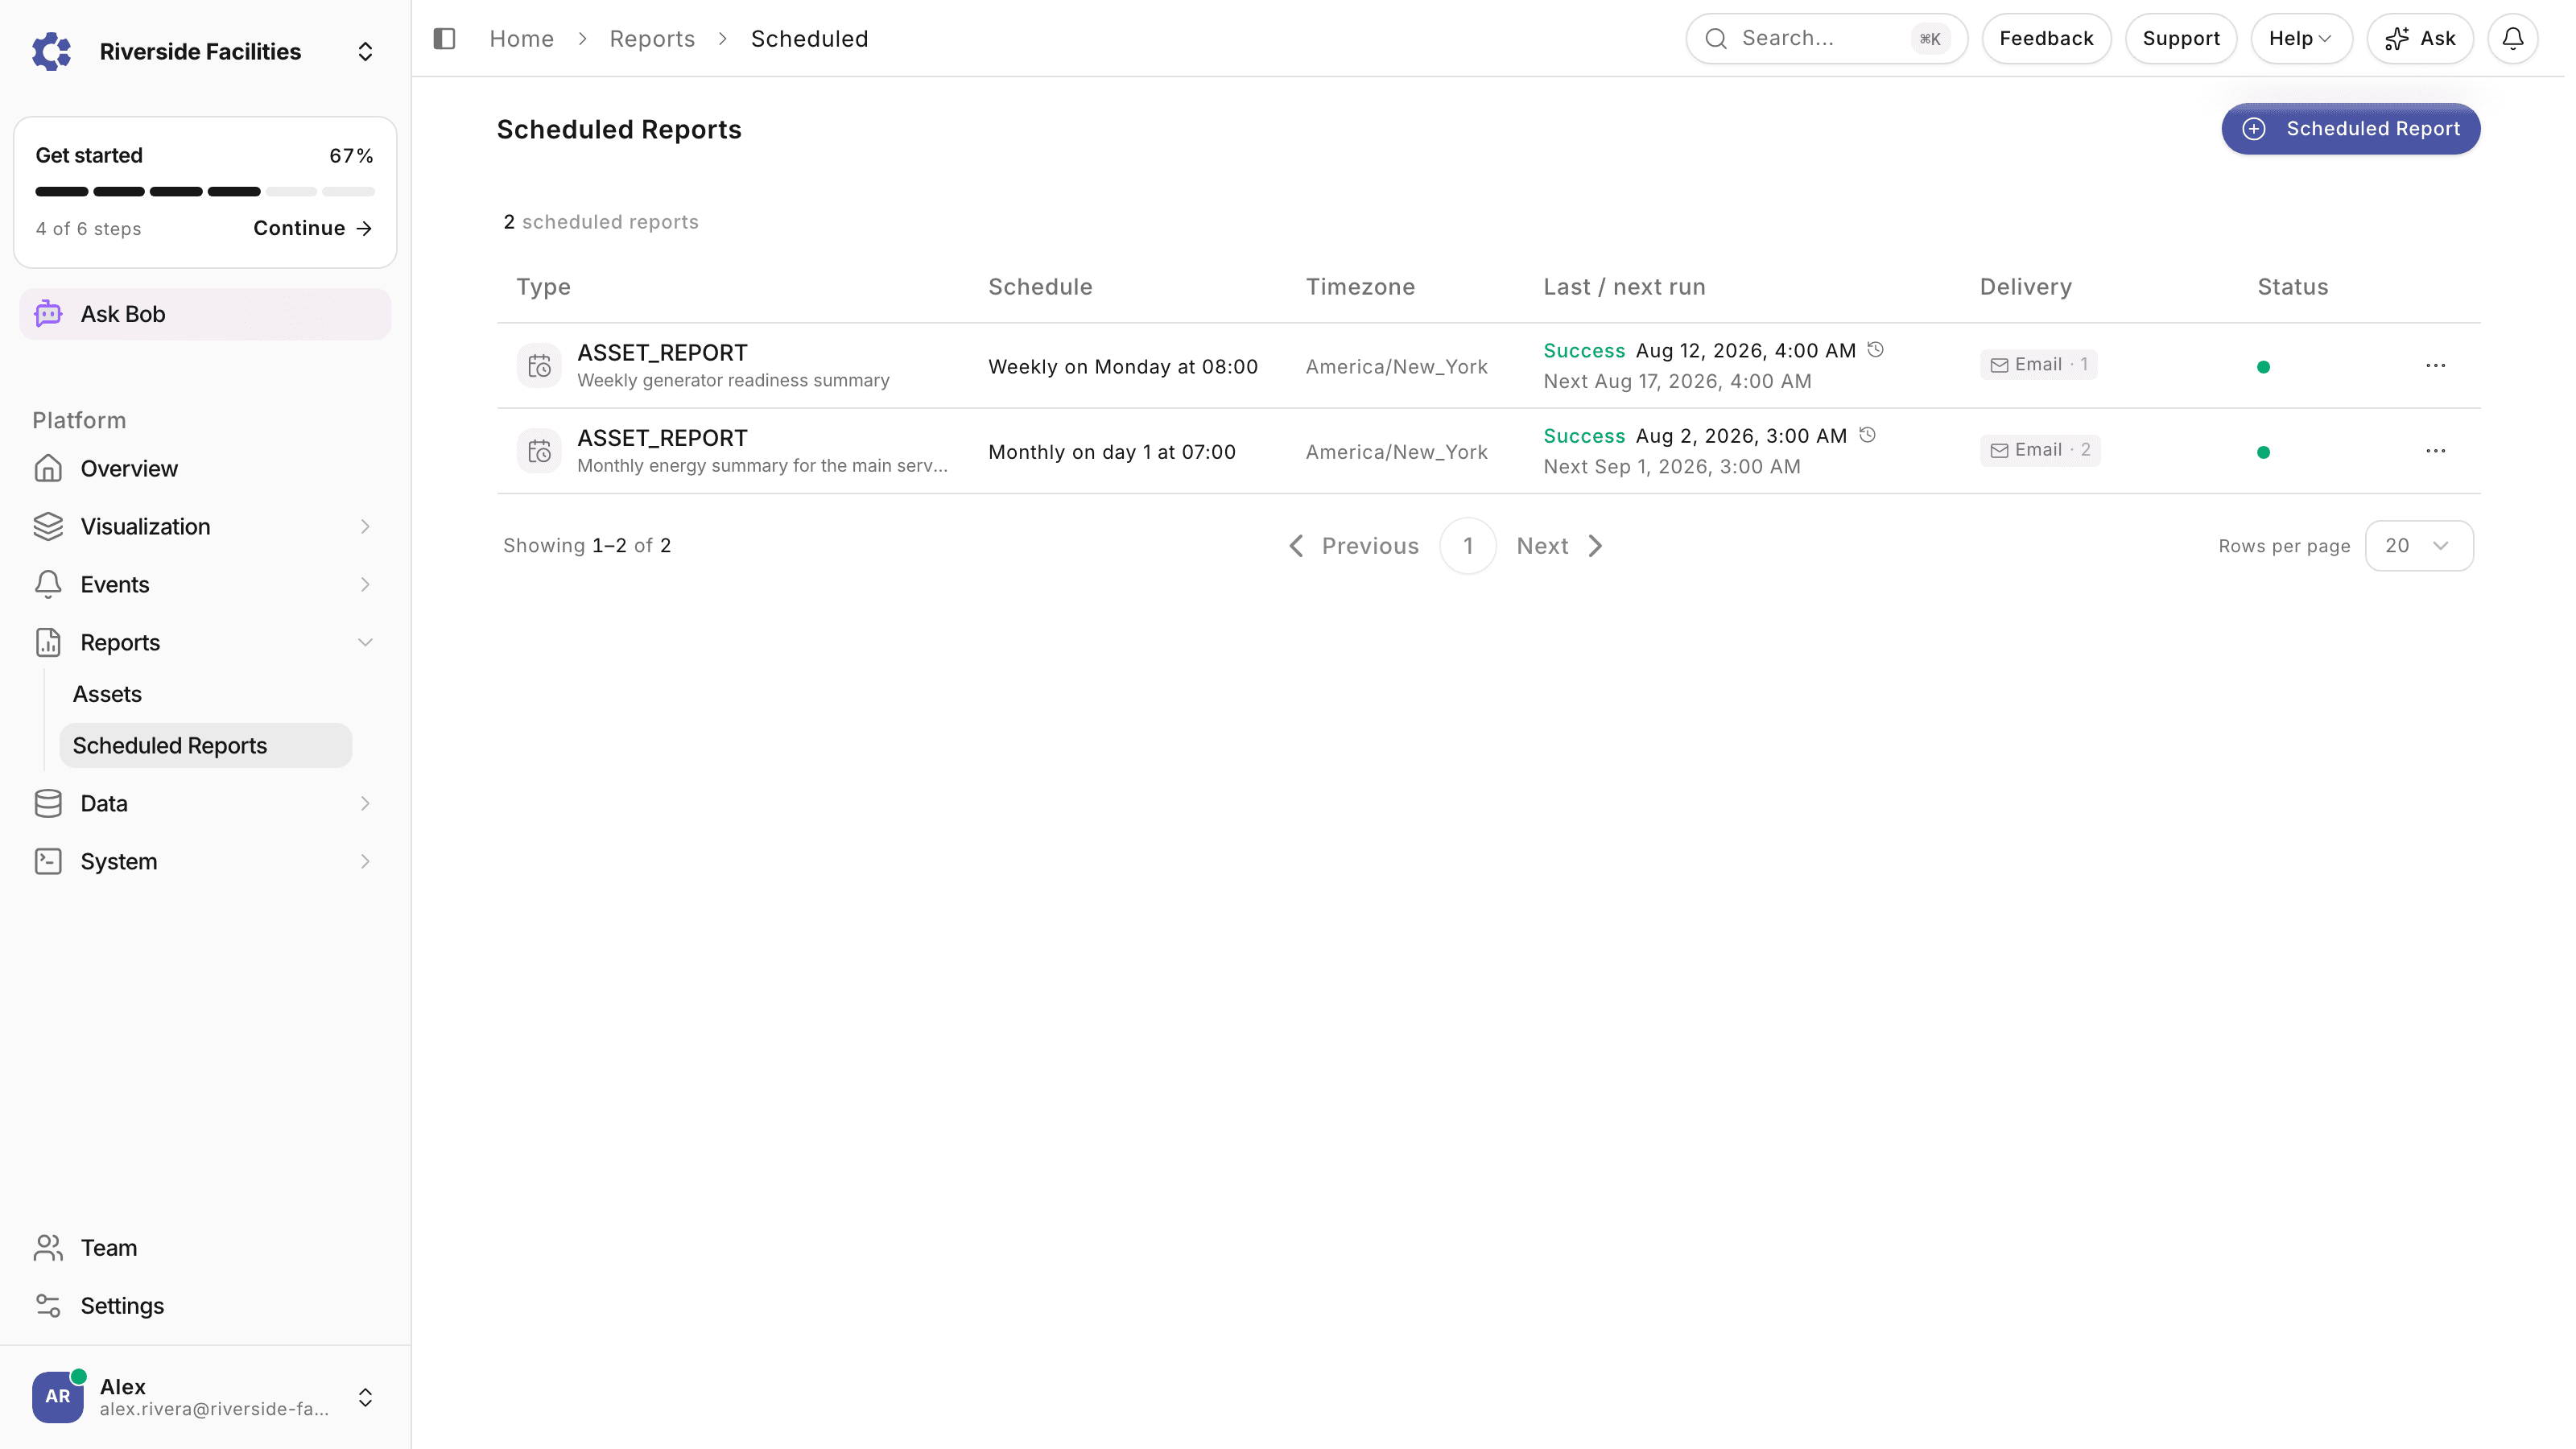
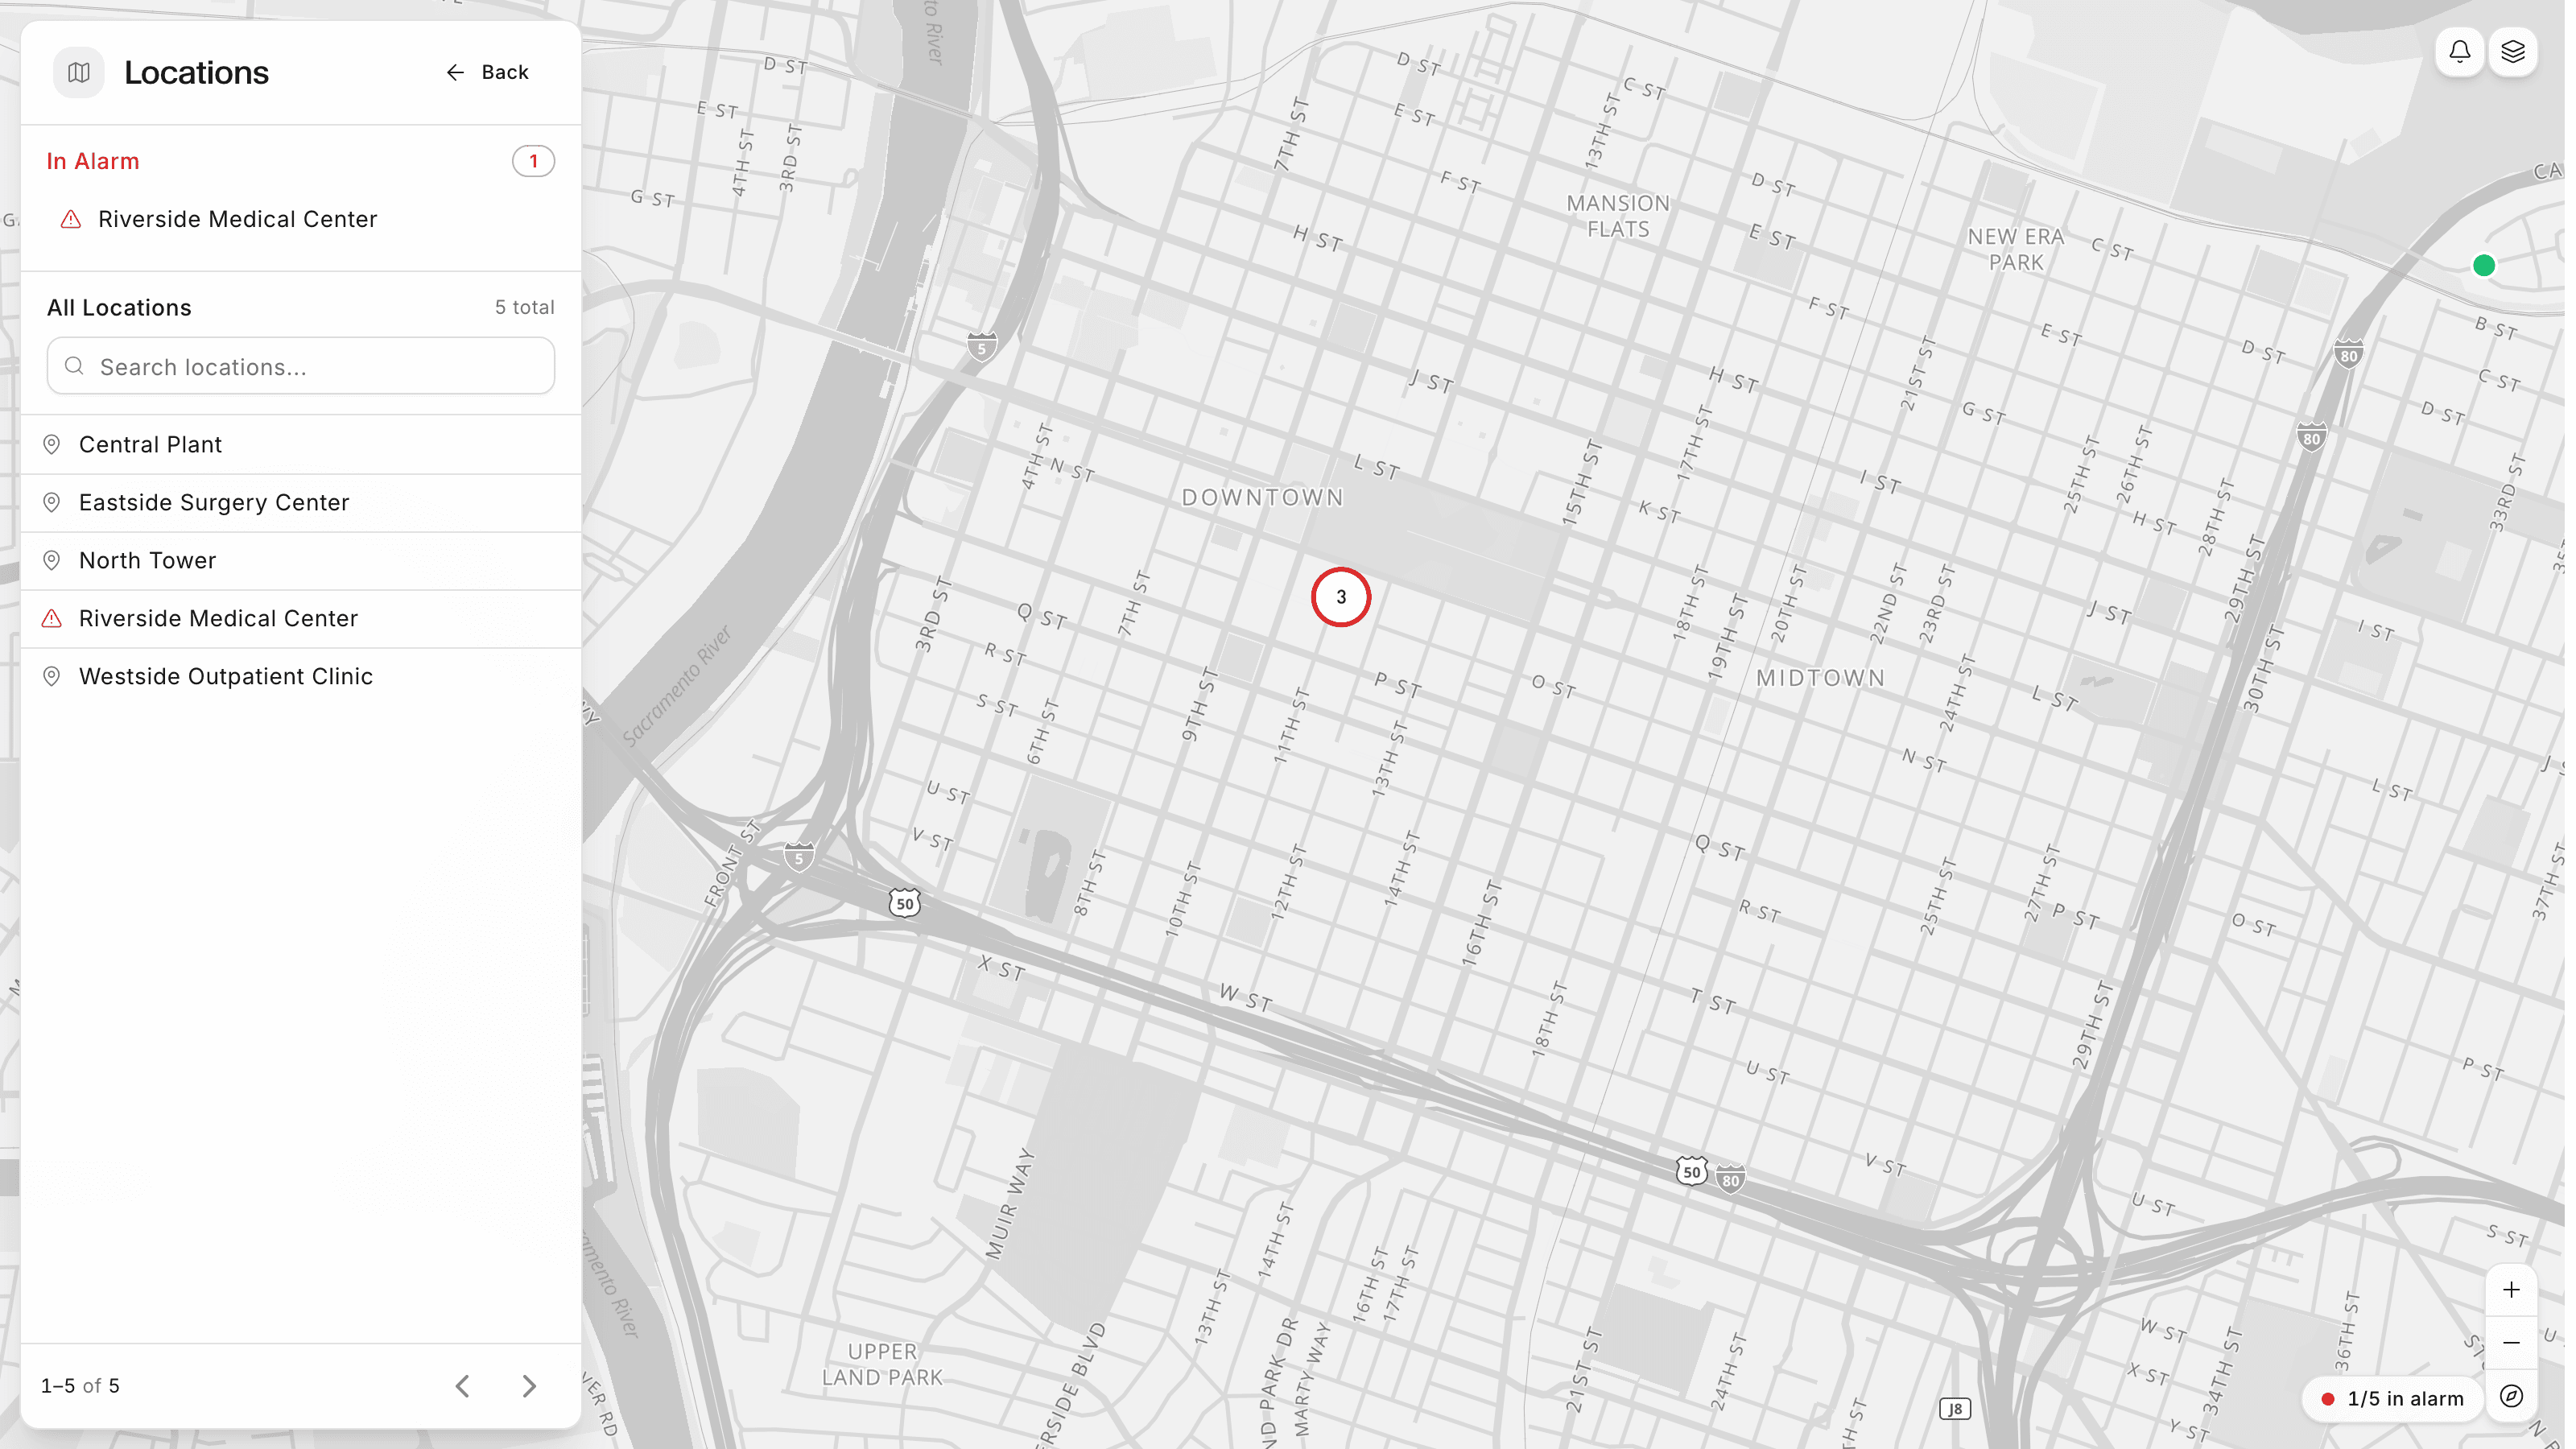
A Tuesday morning with the platform starts on the Map: every building on one screen, and the one that needs attention already colored by its alarm state. The Alarms page then answers the follow-up questions in four cards: what is critical, what is still awaiting acknowledgement, what has nobody assigned, and what fired in the last 24 hours. Monday's weekly digest has already recapped which alarms fired most and what changed in the organization, and the scheduled reports list confirms the month's PDFs went out, showing the last result and the next run for every job. The first hour of the day is triage from one screen, not a tour of vendor logins.
Nothing is ripped out. Existing BMS, controllers and meters stay in place while the platform reads alongside them, so one facility manager can watch twenty buildings with the attention they used to give one.
Without a monitoring layer, the facility manager fills the gap with logins, phone calls and spreadsheets.
Every vendor system ships its own portal, so a morning check of the portfolio means a dozen logins, and comparing buildings means exporting readings into a spreadsheet that is stale before it is finished.
Failures surface as a tenant complaint or an after-hours call, not as data. By the time someone arrives, a tripped chiller or a failed compressor has been down for hours and the repair bills at emergency rates.
Monthly energy summaries, generator test logs and compliance paperwork get compiled by hand from portal screenshots and CSV exports, which eats hours every month and still leaves gaps an auditor can find.
Three jobs, done by the platform instead of by hand: see everything, hear about problems first, hand over the paperwork.
ControlCom Connect plots every location on a full-screen map, colored by live alarm state, so the answer to which building is in trouble right now is a glance, not a login. Drill from the map into a site and its assets without leaving the page, while dashboards assemble the widgets each building or the whole portfolio needs. The same view scales from an office portfolio to a hospital campus where the buildings carry life-safety equipment as well as comfort systems.

An alarm watches a reading against a threshold. When it crosses, the platform records the event and notifies everyone subscribed to the alarm group by SMS, email or push notification. When the reading recovers, the alarm records that too, so the history shows how long each condition lasted and who was told.

Asset reports cover a rolling window such as the last 30 days, run daily, weekly or monthly, and arrive in each recipient inbox as a PDF. Generator compliance reports cover Joint Commission testing evidence and EPA runtime reporting, so the paperwork a facility audit asks for comes out of the platform instead of a binder. The same stored readings feed the energy management work of checking utility bills against metered data, and the broader compliance workflows built on the audit trail.

At 2:04am, the chilled-water supply temperature at one of twelve buildings crosses its threshold. The alarm waits out its processing delay, re-reads the value, and pages the on-call technician by SMS through the Critical Mechanical group; nobody else is woken. The acknowledgement lands on the event with a name and a time, the fix goes into the event notes, and the reading's recovery closes the loop in the history. On Tuesday morning the facility manager reads the whole episode in two minutes: how long the condition lasted, who was told on which channel, what was done, and what the building dashboard shows now that the plant is back in its normal band. The tenant on the seventh floor never files the complaint.
Building systems monitoring only works if it speaks to the equipment already installed. That is the job of the Edge Server.
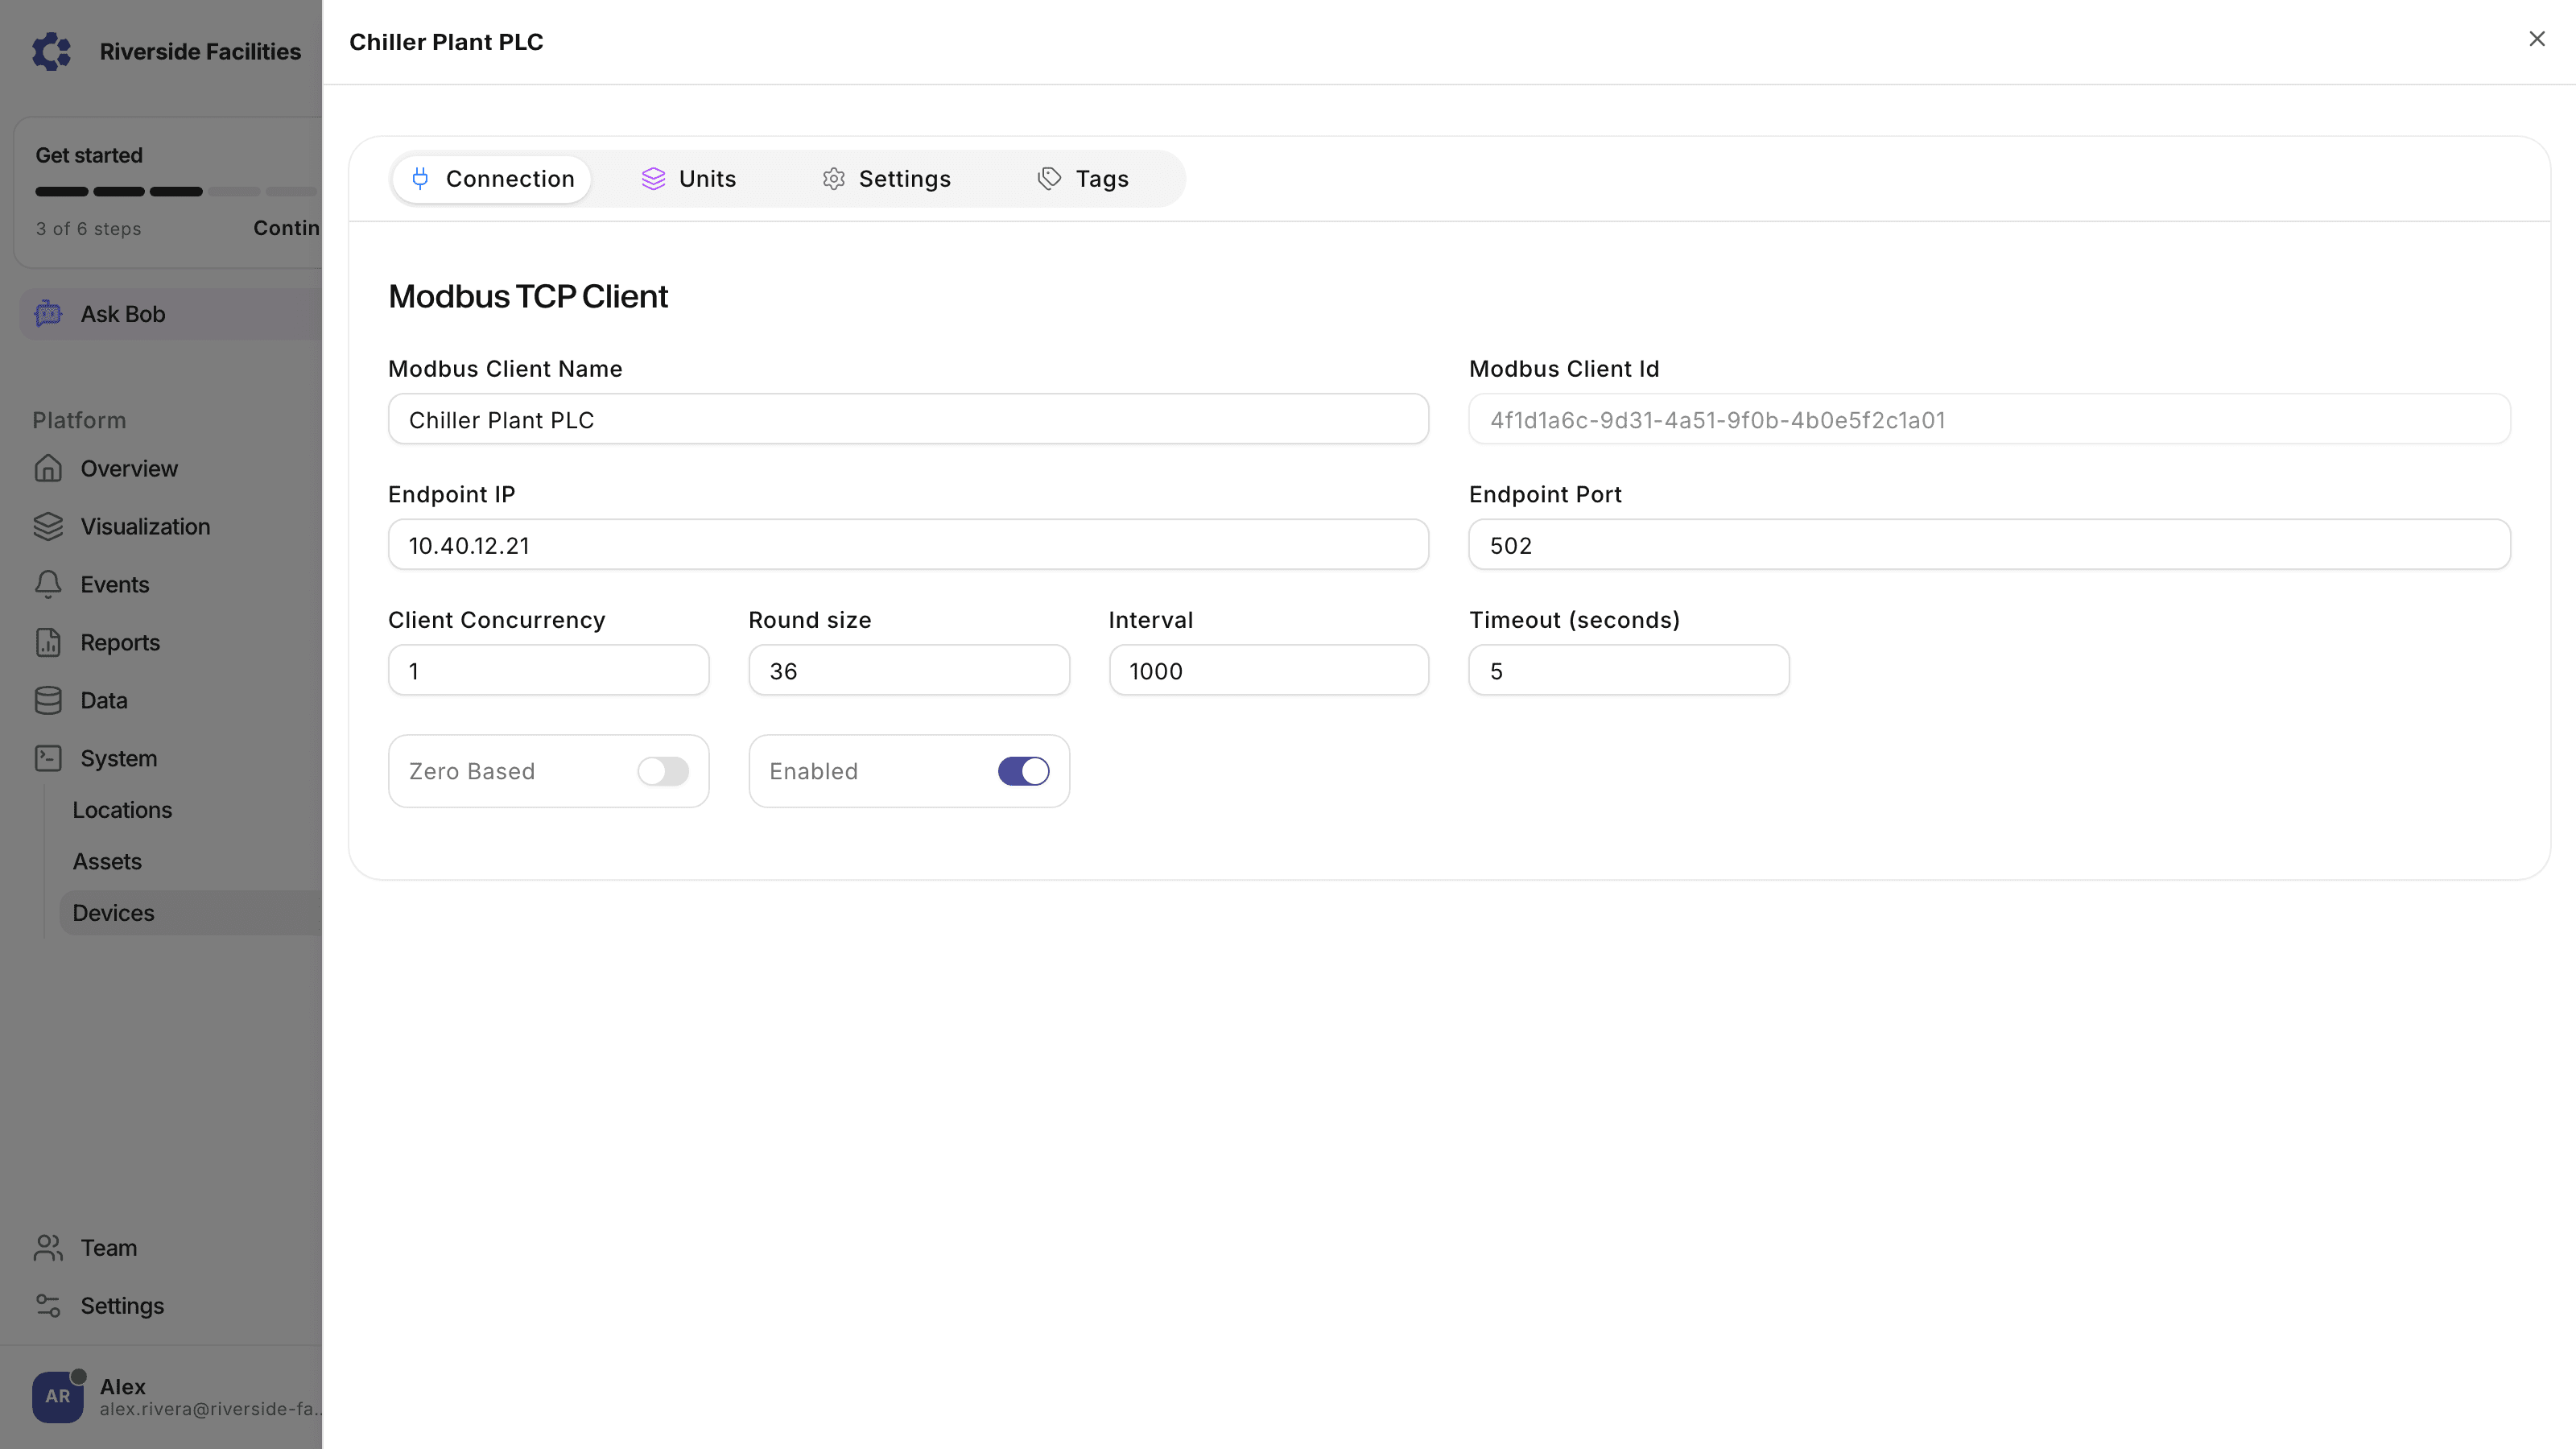
A ControlCom Edge Server runs on site and reads your equipment over Modbus, OPC-UA, BACnet and EtherNet/IP, the protocols building systems already speak. Controllers, BMS and meters keep doing their jobs while it reads alongside them, buffers data locally, and keeps local views and alarms alive when the building loses its internet connection.

The questions facility managers ask when evaluating building monitoring software.
Whatever your buildings report: HVAC plants, chillers and boilers, generators and transfer switches, electrical meters and panels, refrigeration, pumps and water systems. Each piece of equipment becomes an asset in the platform with the variables that report on it attached, and an asset can pull from several devices, so a controller replacement never reshuffles the operational view. Thresholds on those variables turn readings into alarms with a severity from Info to Critical, and each asset carries its own detail page with live values, history, active alarms and the reports generated against it. The practical test is protocol support rather than equipment category: if a system speaks Modbus, OPC-UA, BACnet or EtherNet/IP, the on-site Edge Server can read it, which covers most building automation, metering and packaged plant equipment a portfolio is likely to hold.
Where ControlCom Connect fits the rest of your operation.
Compliance tracking, equipment monitoring and energy optimization for hospitals and healthcare networks.
Generator runtime, fuel, transfer switches, and EPA hours for facilities that carry their own load.
Utility bills, load factor, and schedule waste across the buildings you own, from the same readings.
Automate the data capture and reporting workflows that regulators and auditors expect from your facilities.
A healthcare provider used continuous utility monitoring to find and correct $160K in billing errors.
A hospital handed an engineering firm a complete energy study from stored readings, saving months and up to $30K.
A 30-minute demo with engineers who have run the building, on the equipment you already own.