Diagram Editor: Faster Performance and In-Diagram Graphs
What's New in the Diagram Editor
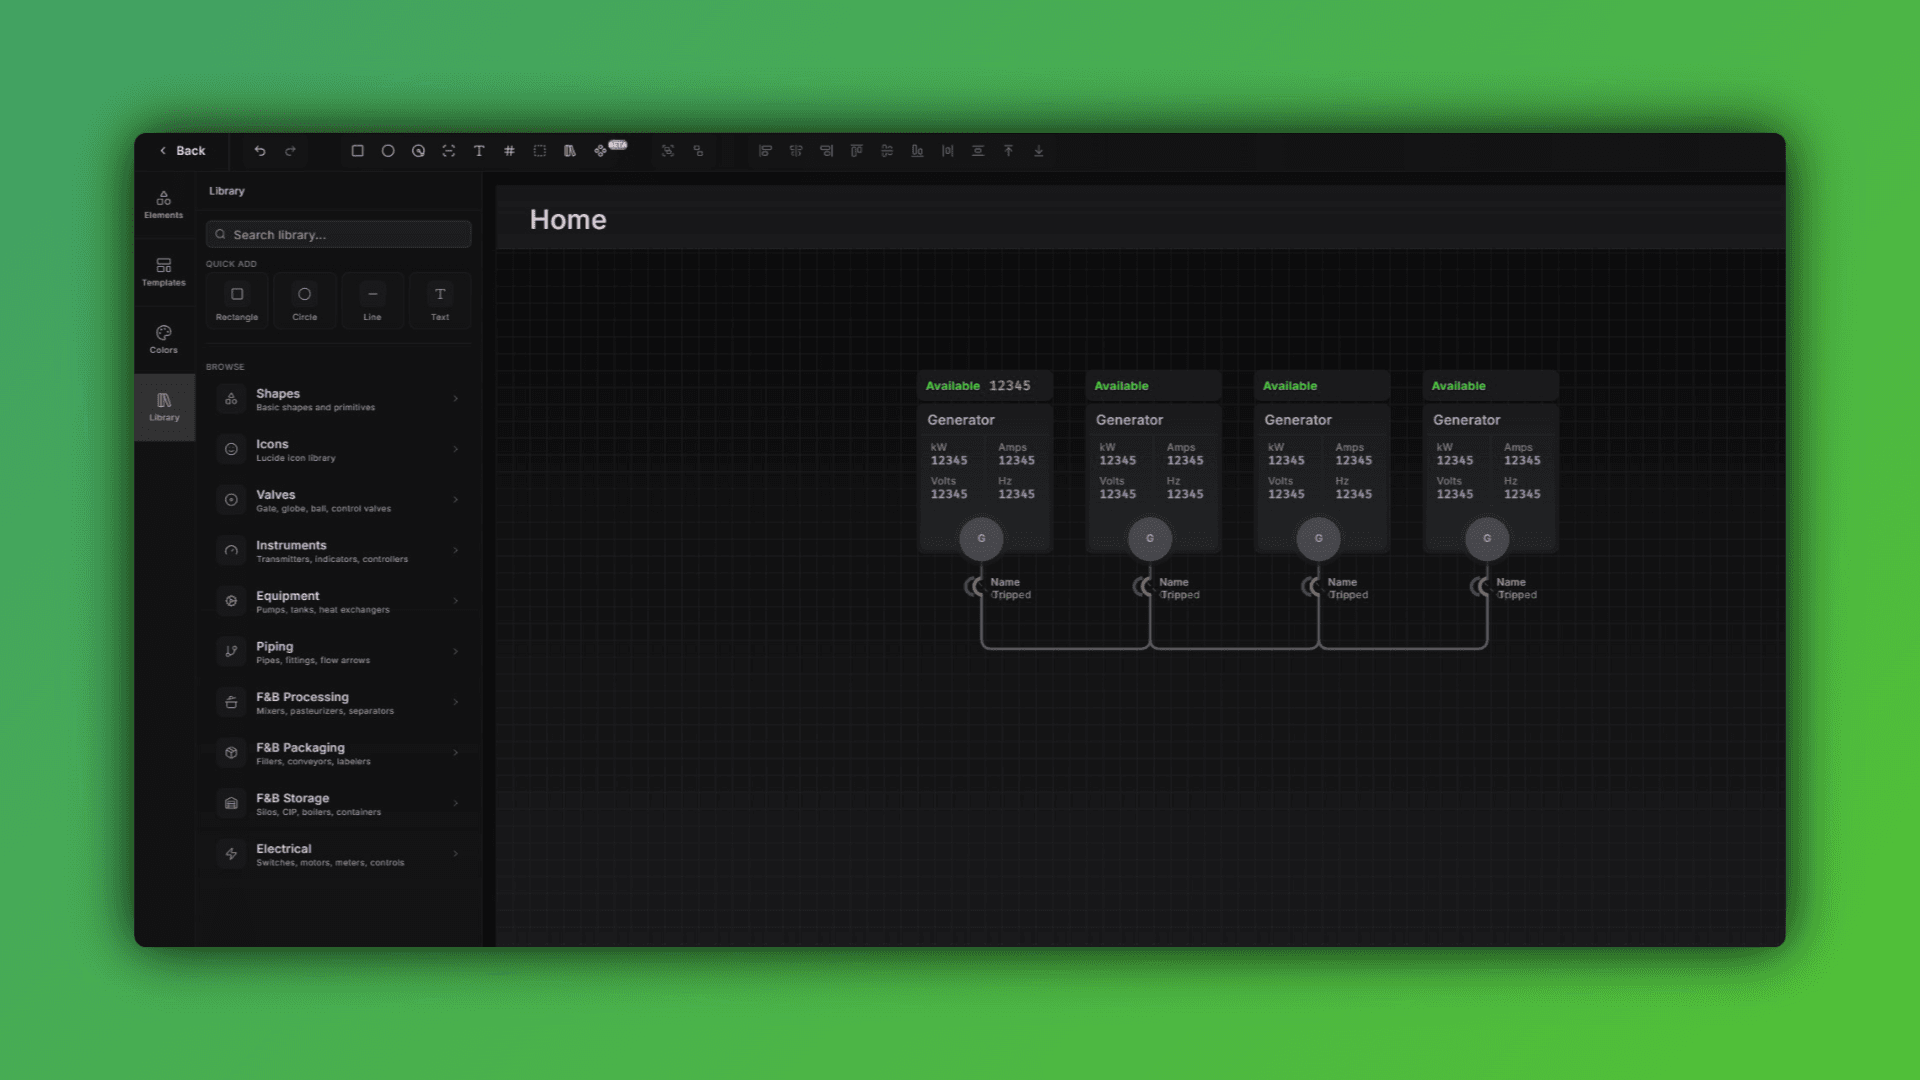
If you're building out system diagrams for large facilities or complex IIoT architectures, this update is going to make that work noticeably faster and more flexible.
Here's what changed:
Performance Improvements for Large Diagrams
Diagrams with high element counts or large canvas sizes now load and respond significantly faster. Whether you're mapping a full water treatment plant or a multi-zone manufacturing floor, you'll see less lag when moving, selecting, or editing at scale.
Fill Properties with Animation on Elements
You can now control fill color and style on individual diagram elements based on your variable's value - allowing you to create bar fills, tanks or other necessary items.
Insert Graphs Directly into Diagrams
Need to show live trends or historical data alongside your system layout? You can now embed graphs directly on the diagram canvas. This means your operators get context — not just topology.
Quick-Edit Bar for Multi-Element Formatting
Select multiple elements and change font size, corner radius, and stroke weight all at once from the quick-edit bar. No more editing items one at a time to keep things consistent across a diagram.
New Line Path Styles
Three new path options are now available for connectors:
Elbow
Smooth Elbow
Curved
These changes came directly from feedback from integrators managing large-scale monitoring deployments. More diagram editor updates are in the pipeline — if you have something specific you're working around, reach out.