Explorer v2, Professional IoT Time-Series Data Analysis
Overview
Explorer v2 is a professional-grade time-series data visualization and analysis tool designed for IoT device monitoring and operations. It provides real-time and historical data exploration with advanced statistical analysis, intelligent time-range management, and high-performance rendering capable of handling 10,000+ data points smoothly.
What's New
Raw Mode — See unprocessed sensor data for the last hour. Great for troubleshooting recent issues or checking what's happening right now. Limited to 16 variables max to keep things fast.
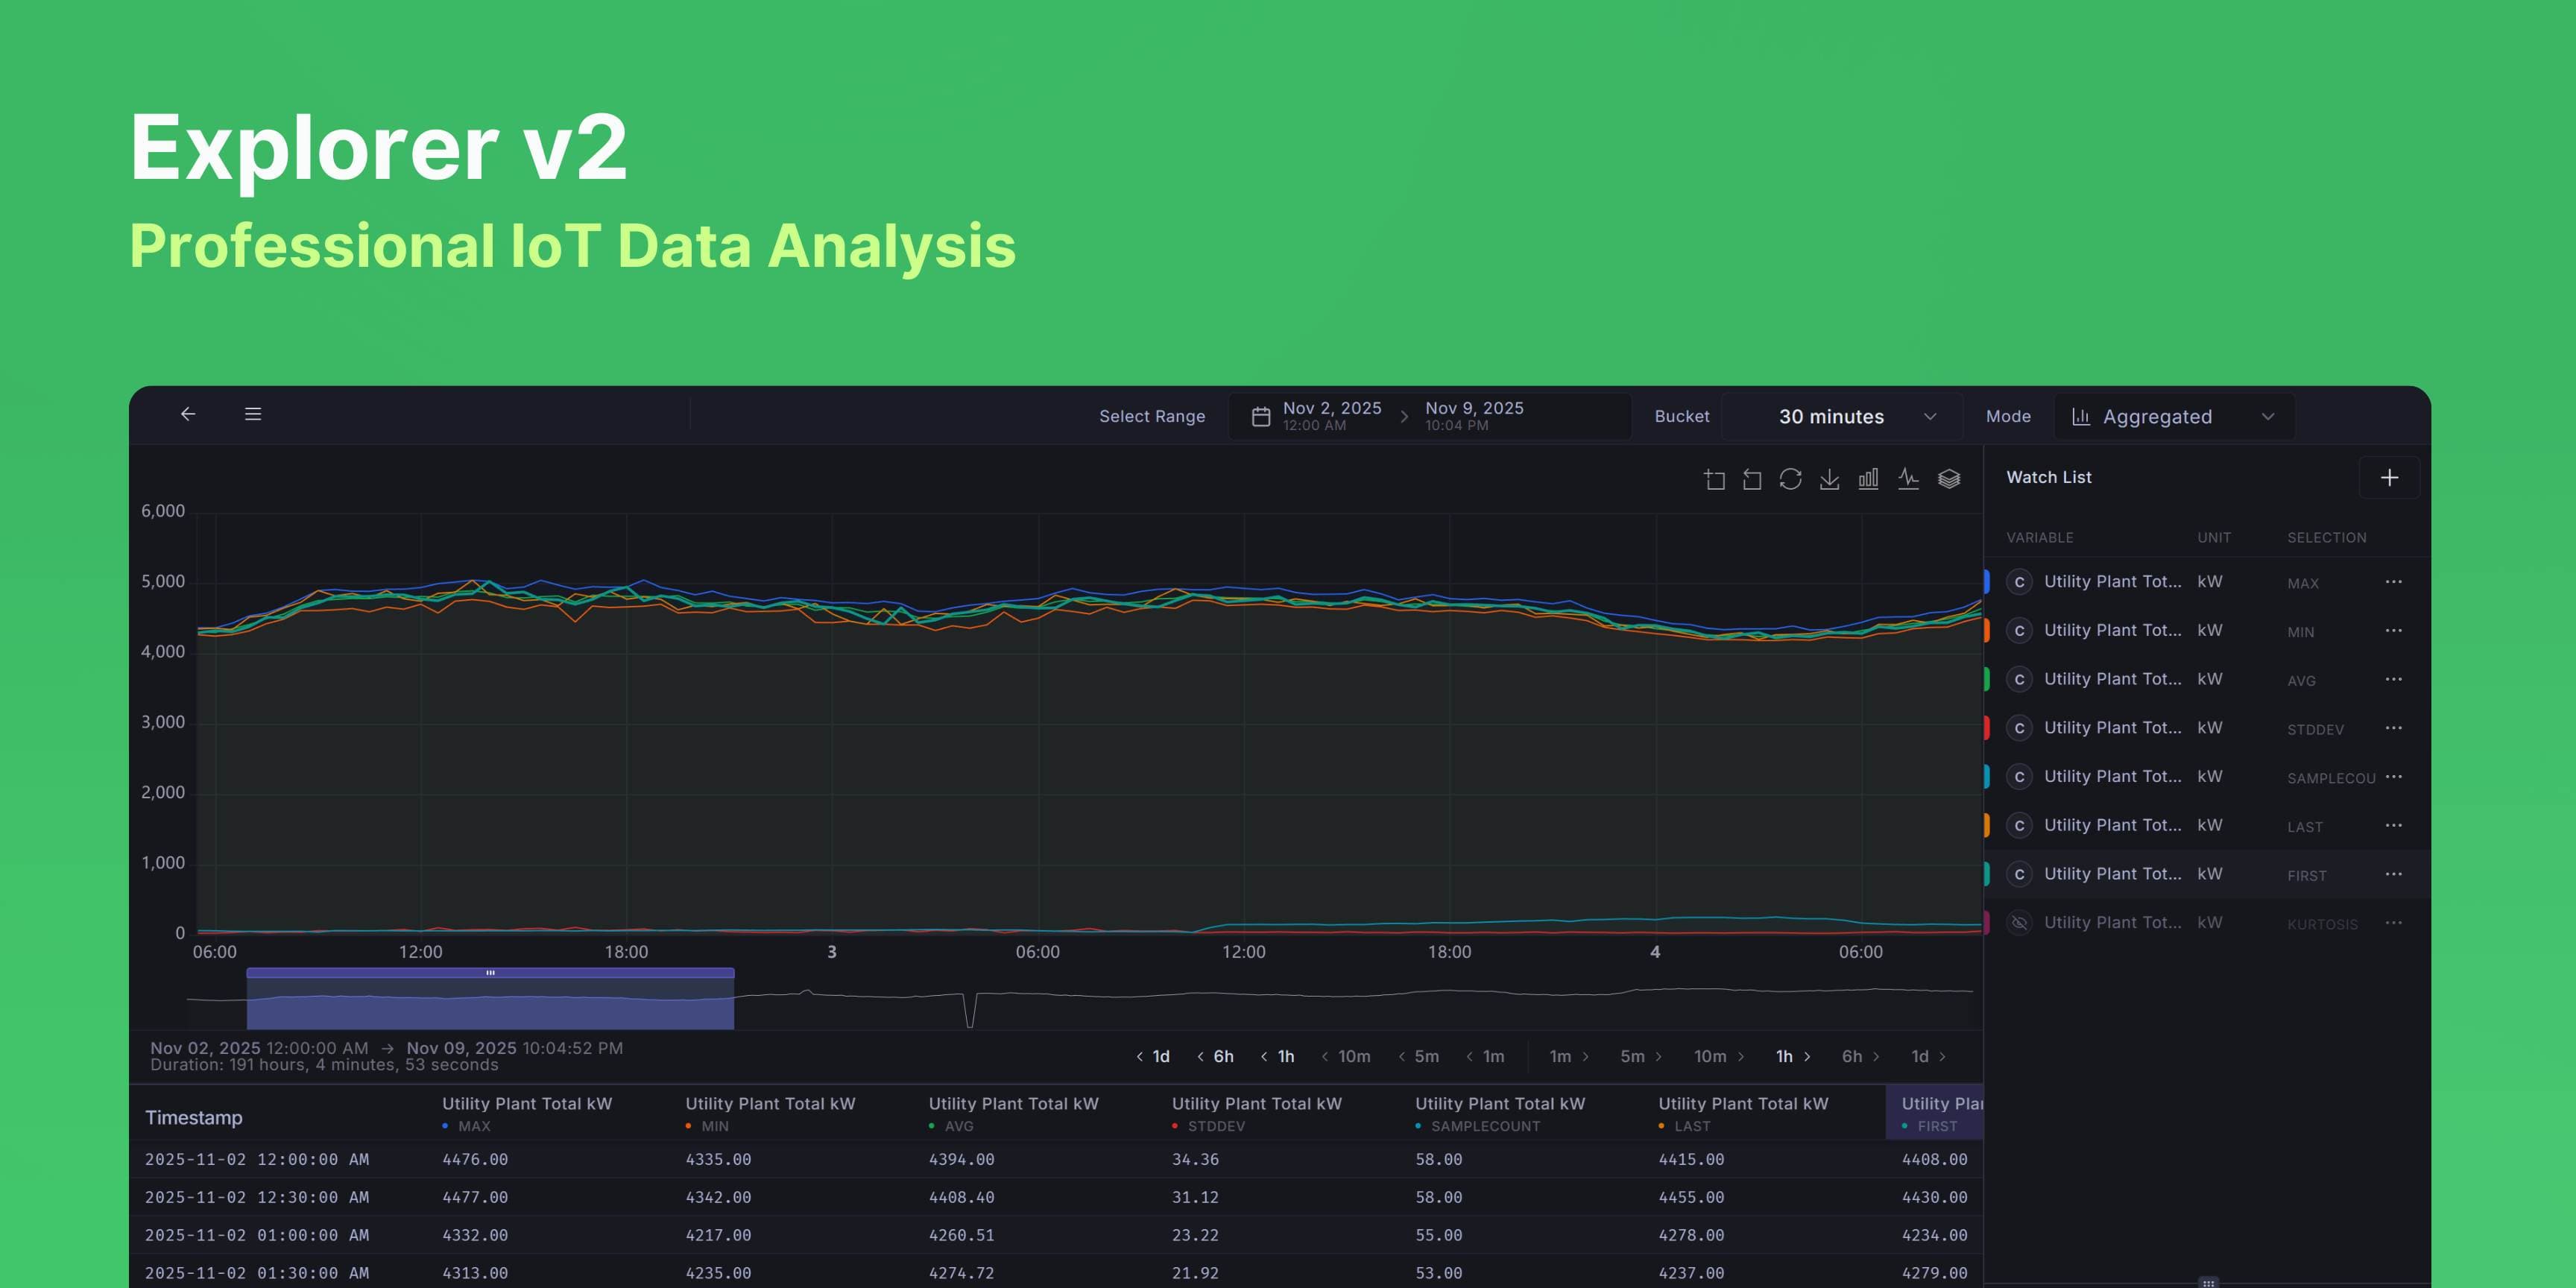
Aggregated Mode — View statistical summaries over any time range. Add the same variable multiple times with different aggregations (MIN, MAX, AVG, etc.) to compare patterns. No variable limits.
In Aggregated Mode, you can view data as MIN, MAX, AVG, SUM, Standard Deviation, Sample Count, Kurtosis, First Value, or Last Value. Add the same sensor multiple times with different aggregations to see the full picture — like plotting MIN, MAX, and AVG of a temperature sensor together to see its range.
Buckets have range requirements (e.g., 1-hour buckets need at least 24 hours of data). When you pick an incompatible bucket, Explorer suggests three ways to fix your time range: extend/shrink the end date, extend/shrink the start date, or center and adjust both. Click any suggestion and it applies the fix, switches buckets, and refreshes your data.
Renders 10,000+ data points smoothly without lag. Panels resize by dragging, charts zoom and pan, and hovering table columns highlights the chart series. Time jump buttons let you skip forward/backward by preset intervals. Export to CSV with one click.
How people use it
For troubleshooting, switch to Raw Mode and look at the last hour of unprocessed data. For monthly reports, use Aggregated Mode with 1-day buckets and plot MIN, MAX, and AVG together to show daily ranges. To find problem devices, compare the Standard Deviation across multiple devices — high variability usually means something's wrong.
Coming soon
Alarm overlays on the timeline, annotations for specific time periods, and side-by-side time range comparison.