Diagrams Updates
7 updates in this category.
June 30, 2026
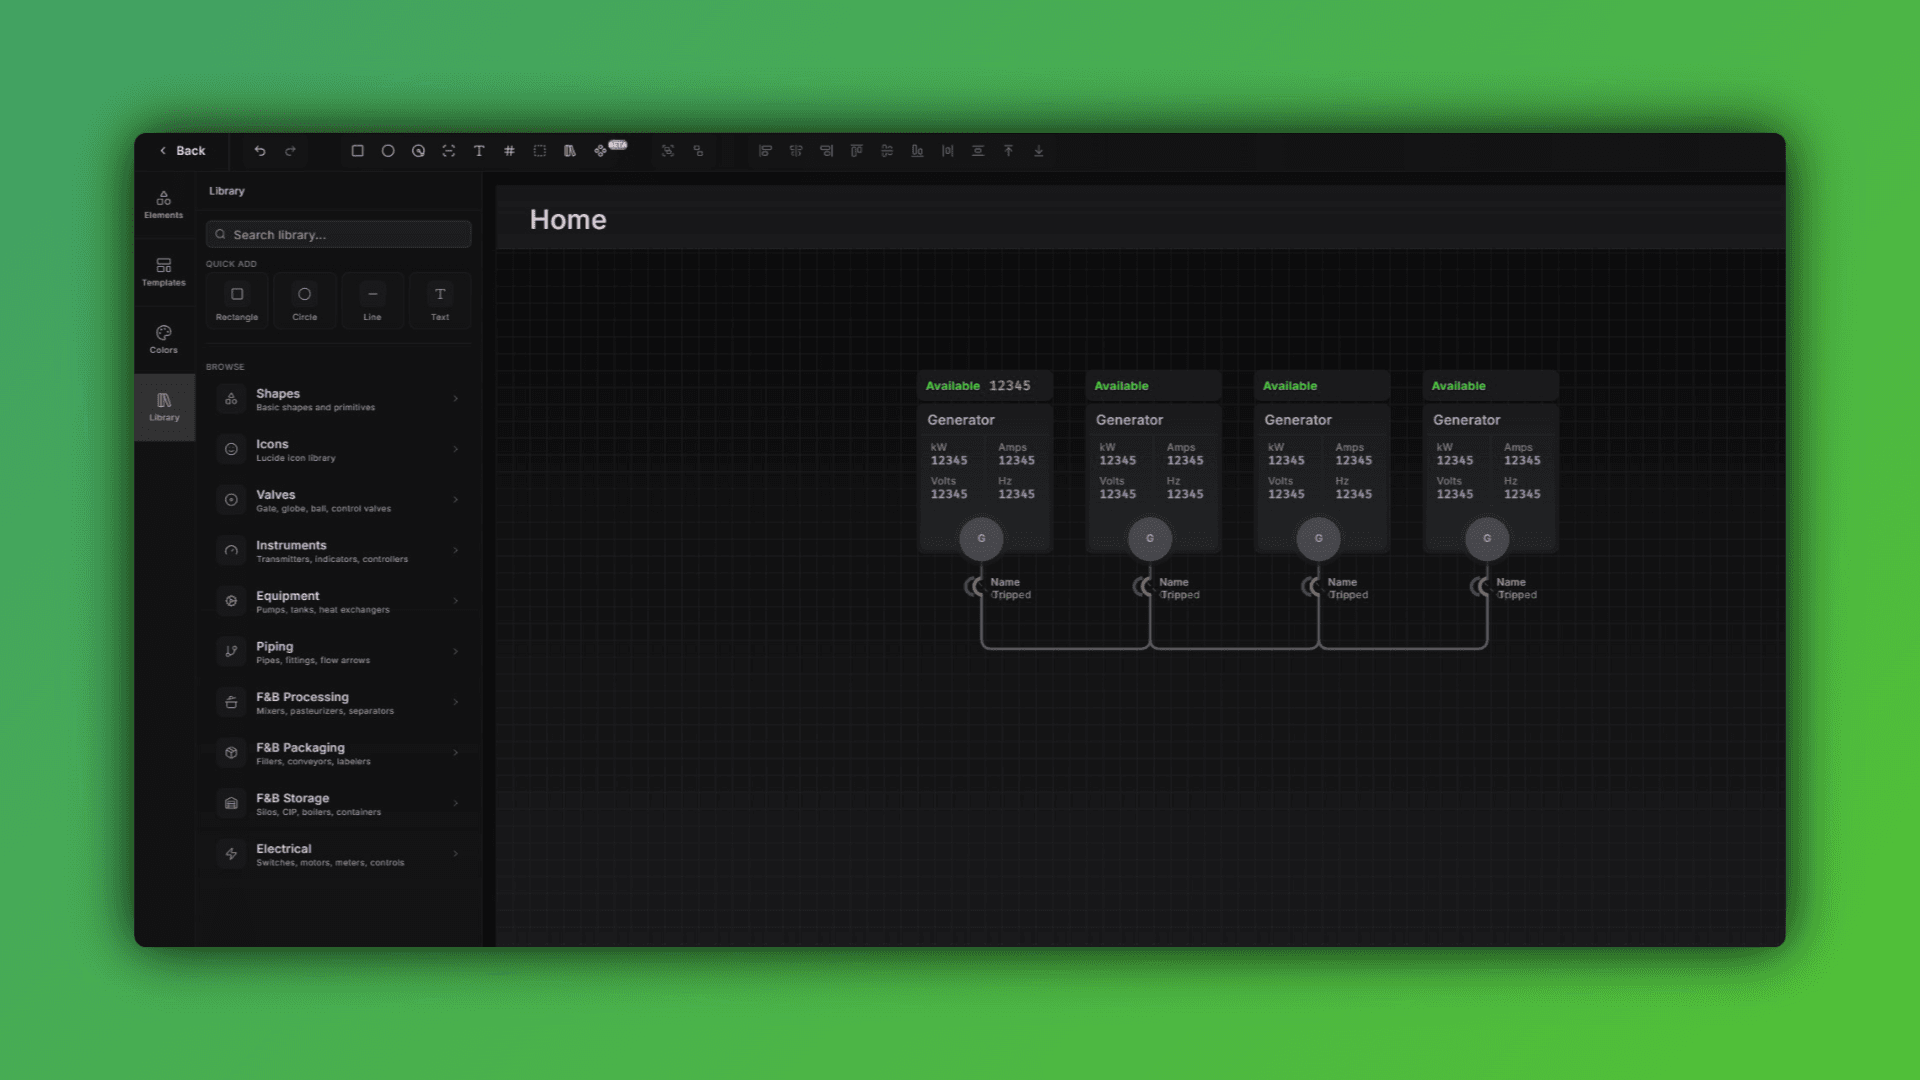
Diagrams light & dark mode
Hierarchical HMI and Diagrams
Building complex visual interfaces for water/wastewater or manufacturing sites is faster with new reusable structures and logic tools in the HMI editor.
Nested Diagram Instances: Create reusable diagram components and nest them within larger views to build hierarchical monitoring structures.
Local Variables: Use local variables within diagram instances to create more dynamic and responsive visual elements.
Visual Enhancements: Add pulse animations, drop shadows, and arrowheads to lines to improve clarity for operators.
Global Color Replacement: Quickly update the visual style of an entire diagram by replacing specific colors or dark mode variants in one step.
Dashboard and Workflow Updates
New widgets and navigation tools help you access critical data with fewer clicks.
Asset Table Widget: Add asset tables directly to your dashboards to view and interact with equipment data in a consolidated view.
Sidebar Shortcuts: Pin your most frequently used features to the sidebar for immediate access.
Diagram Dark Mode: High-contrast dark mode support is now available for diagrams to reduce eye strain in control room environments.
Location Hierarchy: Visualize your facility structure with an improved tree view for better organization of distributed assets.
May 1, 2026
Predictive Monitoring With Anomaly Detection
This update to ControlCom Connect introduces smarter ways to monitor your industrial assets and faster tools to design your HMI screens. From spotting unusual data patterns automatically to streamlining how you edit complex system diagrams, these changes focus on reducing downtime and saving engineering time.
Identify Issues Sooner with Anomaly Detection
You can now enable anomaly detection to automatically identify unusual patterns in your data. Instead of relying solely on fixed thresholds, this feature helps plant managers and operators catch deviations that might indicate equipment failure or process inefficiencies before they trigger a critical alarm.
Faster HMI Design and Bulk Editing
Building detailed diagrams for water/wastewater facilities or manufacturing lines is now much more efficient with new multi-select and text tools.
- Multi-Element Editing: Select and edit multiple HMI elements simultaneously. This means you can update colors, sizes, or properties across a group of components at once, rather than one by one.
- Diagram Text Search: You can now find and replace text content within your diagrams. This is perfect for quickly updating labels or descriptions across large-scale system views.
- Visual Status Indicators: Diagram elements can now pulsate when an associated variable is "on." This provides an immediate, clear visual indicator of active machinery or flows.
- Enhanced Button States: HMI buttons now support visual states for warnings, errors, and success, giving operators better feedback on system actions.
Smoother Dashboard Trends and Commands
Viewing and interacting with live data is now more intuitive with improved graph controls and command management.
- Scrolling Live Graphs: Live graphs on your dashboard now support scrolling. This lets you view longer trends and historical data without interrupting the live feed.
- Bulk Command Imports: Save time during site setup by importing multiple device commands at once. We have also improved the workflow for sending commands directly from the diagram editor.
- Interactive Analytics: New analytics features provide deeper insights into your facility data, paired with a smoother, more responsive experience in the live graph view.
April 23, 2026
Expanded API and Improved Diagram Controls
ControlCom Connect continues to evolve as a flexible hub for industrial monitoring and analytics. This latest update focuses on providing integrators with more powerful tools to customize the platform and gives operators more granular control over their system visualizations.
Standardized API for Custom Integrations
We have significantly expanded and standardized the ControlCom Connect API to make it easier for you to build custom applications or connect the platform with your existing SCADA, ERP, or maintenance management software. This makes the platform more adaptable for water/wastewater, manufacturing, and healthcare facilities that require specialized data flows.
New Data Endpoints: You can now programmatically manage energy management bills, weather data, and AI chat sessions.
Organization Branding: Automate how your branding and organization settings are applied across the platform.
Broad Support: We have enhanced API support for managing alarms, assets, devices, virtual variables, and user profiles, ensuring a consistent developer experience.
More Control Over HMI Diagrams
Building and maintaining your digital twin diagrams is now more efficient. New refinements allow for better organization and more precise visual feedback on the plant floor.
Granular Instance Visibility: You now have the power to control the visibility of individual instances directly within your diagrams. This means you can show or hide specific components based on operational needs without affecting the rest of the layout.
Streamlined Publishing: To help keep your projects organized, you can now rename a diagram at the moment you publish it. This simplifies versioning and ensures that your operator screens always have clear, descriptive names.
Accurate Gauge Visuals: We have improved the rendering of radial gauges. These indicators now display data with higher precision, giving your team a more reliable view of critical metrics like pressure, flow, and tank levels.
April 16, 2026
Find and Replace + Radial Cards in the Diagram Editor
Building complex HMI screens for your industrial systems just got much faster. The latest update to ControlCom Connect focuses on reducing the manual work required to build and maintain detailed system diagrams, especially when managing large numbers of variables across production lines.
Find and Replace Variables
When you are managing a large-scale deployment, updating variable mappings one by one is time-consuming. Now you can find and replace variables directly within the diagram editor. This makes it easier to duplicate screens for similar assets or update your data mapping without rebuilding elements from scratch.
New Radial Card Visuals
This update adds a Radial Card primitive to your toolkit. This new element provides a clean, circular visual for displaying key performance indicators (KPIs) like pressure, temperature, or motor speed. It is designed to give operators high-level status updates that are easy to read from across the plant floor.
Advanced Element Control and Logic
We have added more sophisticated controls for element visibility. This means you can create dynamic diagrams where parts of the interface appear or disappear based on real-time machine states. To help you set this up faster, the expression editor now includes quick actions for common logic tasks.
Improved Configuration Tools
Managing your hardware connections is now simpler with several updates to our core tools:
- MODBUS Client Editor: A more intuitive interface for configuring your MODBUS devices and addressing.
- Variable Selection: A smoother experience when browsing and selecting tags for your HMI elements.
- Asset and Namespace Display: Clearer organization of your facility data, making it easier to find the right sensor in a large hierarchy.
These improvements were built for integrators who need to deploy systems quickly while maintaining a high standard of visual clarity for plant managers and operators.
April 12, 2026
Interactive HMI Screens and Asset Management
This update for ControlCom Connect introduces interactive controls to your system diagrams and provides better tools for managing your facility hierarchy. Whether you are an integrator setting up a new site or a plant manager cleaning up old data, these changes make the platform more functional and easier to navigate.
Interactive Buttons for HMI Diagrams
You can now add interactive button elements directly to your diagrams within the HMI Editor. This allows you to build more functional interfaces for your operators. Instead of just viewing data, you can design your SCADA-style screens to include triggers for specific actions or navigation paths.
- Custom actions: Configure buttons to interact with your system variables.
- Simplified navigation: Create buttons that jump between different assets or locations.
- Clearer interfaces: Use buttons to toggle views or reset dashboard parameters.
Streamlined Asset and Location Management
Keeping your IIoT environment organized is now easier. We have added the ability to delete locations and assets directly from the platform. If equipment is decommissioned or a site layout changes, you can remove those items to keep your views relevant and uncluttered.
This is particularly useful for large-scale deployments in water/wastewater or manufacturing where assets are frequently rotated or updated. Removing old assets ensures your team focuses only on live, active equipment.
Visual Refinements
We have also polished the appearance of the data tables and graphs within the Explorer. These visual enhancements make it easier to read high-density industrial data at a glance, helping you identify trends or anomalies faster during your daily monitoring routines.
March 20, 2026
Diagram Editor: Faster Performance and In-Diagram Graphs
What's New in the Diagram Editor
If you're building out system diagrams for large facilities or complex IIoT architectures, this update is going to make that work noticeably faster and more flexible.
Here's what changed:
Performance Improvements for Large Diagrams
Diagrams with high element counts or large canvas sizes now load and respond significantly faster. Whether you're mapping a full water treatment plant or a multi-zone manufacturing floor, you'll see less lag when moving, selecting, or editing at scale.
Fill Properties with Animation on Elements
You can now control fill color and style on individual diagram elements based on your variable's value - allowing you to create bar fills, tanks or other necessary items.
Insert Graphs Directly into Diagrams
Need to show live trends or historical data alongside your system layout? You can now embed graphs directly on the diagram canvas. This means your operators get context — not just topology.
Quick-Edit Bar for Multi-Element Formatting
Select multiple elements and change font size, corner radius, and stroke weight all at once from the quick-edit bar. No more editing items one at a time to keep things consistent across a diagram.
New Line Path Styles
Three new path options are now available for connectors:
Elbow
Smooth Elbow
Curved
These changes came directly from feedback from integrators managing large-scale monitoring deployments. More diagram editor updates are in the pipeline — if you have something specific you're working around, reach out.
November 7, 2025
Diagram Editor - History Retention
Diagram editor now keeps your edit history. Undo and redo your changes without losing work.
Useful when you're making lots of small adjustments and want to revert without manually fixing everything.