Dashboards Updates
8 updates in this category.
June 30, 2026
Diagrams light & dark mode
Hierarchical HMI and Diagrams
Building complex visual interfaces for water/wastewater or manufacturing sites is faster with new reusable structures and logic tools in the HMI editor.
Nested Diagram Instances: Create reusable diagram components and nest them within larger views to build hierarchical monitoring structures.
Local Variables: Use local variables within diagram instances to create more dynamic and responsive visual elements.
Visual Enhancements: Add pulse animations, drop shadows, and arrowheads to lines to improve clarity for operators.
Global Color Replacement: Quickly update the visual style of an entire diagram by replacing specific colors or dark mode variants in one step.
Dashboard and Workflow Updates
New widgets and navigation tools help you access critical data with fewer clicks.
Asset Table Widget: Add asset tables directly to your dashboards to view and interact with equipment data in a consolidated view.
Sidebar Shortcuts: Pin your most frequently used features to the sidebar for immediate access.
Diagram Dark Mode: High-contrast dark mode support is now available for diagrams to reduce eye strain in control room environments.
Location Hierarchy: Visualize your facility structure with an improved tree view for better organization of distributed assets.
June 4, 2026
Enhanced Alarm Management
This update to ControlCom Connect introduces advanced workflows for managing industrial alerts and more ways to share your data. Plant managers and integrators can now coordinate faster response times through dedicated alarm assignments and real-time interface updates.
Streamlined Alarm Response
Responding to critical events in water/wastewater or manufacturing environments is now more collaborative. These new tools ensure that every alarm is tracked from the moment it triggers until it is resolved.
- Assign and Acknowledge: Now you can assign specific alarms to team members and acknowledge them directly within the platform. This makes it clear who is handling a situation.
- Alarm Troubleshooting Page: A new dedicated view provides context for every event, including timelines and correlation visualizations to help you find the root cause faster.
- Email Notifications: Stay informed immediately when an alarm is assigned to you, reducing response time for critical equipment failures.
- Notes and Context: Add notes to alarms to document troubleshooting steps or provide site-specific context for other operators.
Data Portability and Exports
Moving data out of ControlCom Connect for reporting or secondary analysis is now a simple, one-click process. This is built for facilities that require external documentation for compliance or deeper analytics.
- CSV Timeseries Export: Download raw device data directly into a CSV format for use in spreadsheet software or external databases.
- PNG Chart Export: Save any ECharts visualization as a high-resolution PNG image for inclusion in status reports or maintenance logs.
Real-Time UI and Diagram History
The platform now feels more responsive and provides better protection for your engineering work. Real-time data updates now appear in the UI without requiring a page refresh, keeping your view of the plant floor current.
Version Control for Designs
To protect your configuration work, dashboards and diagrams now maintain a history of the last 20 saves. This allows you to revert changes if a configuration error occurs during site commissioning.
Visual Context in Diagrams
You can now embed images directly into your diagrams. This allows for more realistic HMI screens by including facility photos, equipment schematics, or site maps as a backdrop for your live data points.
May 6, 2026
Device Diagnostics and Security Enhancements
Managing your industrial hardware and facility data is now more transparent. This update to ControlCom Connect brings better diagnostic tools for field devices, enhanced security for large teams, and smarter ways to anticipate system changes through predictive graphing.
Deep Diagnostics for Faster Troubleshooting
Understanding why a device is offline or behaving unexpectedly is now simpler. We have added tools to the Device Details page that provide immediate context for field technicians and plant managers.
Activity Timeline: Track device events over time to see exactly when a status changed.
Troubleshooting Messages: Access a log of device messages from the last 24 hours to identify communication errors quickly.
Health Metrics: View real-time connection status and health indicators directly on the device dashboard.
Live Namespace Values: See variables update in real-time within the interface, ensuring you are looking at current field data.
Enhanced Security and Access Management
As your operations scale, managing who can see and edit specific data becomes critical. ControlCom Connect now supports more granular security protocols and centralized authentication.
Custom User Roles: Assign specific roles to users to control access to features and data sets within the platform.
Login Awareness: New security alerts now include the geographical location of login attempts, helping you identify unauthorized access.
Smarter AI and Predictive Insights
We are making the ControlCom Connect AI Assistant more effective by allowing it to understand the specific context of your industry and facility.
Domain-Specific AI Knowledge
You can now define domain knowledge rules that the AI Assistant uses to provide more accurate answers tailored to your specific facility type, whether it’s water/wastewater, manufacturing, or healthcare.
Trend Predictions on Graphs
Graphs now support trend predictions. This means you can see where your data is heading based on historical patterns, allowing for proactive adjustments before thresholds are reached and alarms are triggered.
Expanded Protocol and Device Support
Connecting a wider variety of hardware is now easier with improved support for popular industrial protocols and bulk configuration tools.
LoRaWAN Management: Connect and manage LoRaWAN devices and gateways directly within the platform.
Sparkplug B Rules: Import Sparkplug B rules via CSV to speed up the configuration of your MQTT-based devices.
Composite Commands: Send more complex instruction sets to your devices, including the ability to copy and paste command configurations between similar hardware.
May 1, 2026
Predictive Monitoring With Anomaly Detection
This update to ControlCom Connect introduces smarter ways to monitor your industrial assets and faster tools to design your HMI screens. From spotting unusual data patterns automatically to streamlining how you edit complex system diagrams, these changes focus on reducing downtime and saving engineering time.
Identify Issues Sooner with Anomaly Detection
You can now enable anomaly detection to automatically identify unusual patterns in your data. Instead of relying solely on fixed thresholds, this feature helps plant managers and operators catch deviations that might indicate equipment failure or process inefficiencies before they trigger a critical alarm.
Faster HMI Design and Bulk Editing
Building detailed diagrams for water/wastewater facilities or manufacturing lines is now much more efficient with new multi-select and text tools.
- Multi-Element Editing: Select and edit multiple HMI elements simultaneously. This means you can update colors, sizes, or properties across a group of components at once, rather than one by one.
- Diagram Text Search: You can now find and replace text content within your diagrams. This is perfect for quickly updating labels or descriptions across large-scale system views.
- Visual Status Indicators: Diagram elements can now pulsate when an associated variable is "on." This provides an immediate, clear visual indicator of active machinery or flows.
- Enhanced Button States: HMI buttons now support visual states for warnings, errors, and success, giving operators better feedback on system actions.
Smoother Dashboard Trends and Commands
Viewing and interacting with live data is now more intuitive with improved graph controls and command management.
- Scrolling Live Graphs: Live graphs on your dashboard now support scrolling. This lets you view longer trends and historical data without interrupting the live feed.
- Bulk Command Imports: Save time during site setup by importing multiple device commands at once. We have also improved the workflow for sending commands directly from the diagram editor.
- Interactive Analytics: New analytics features provide deeper insights into your facility data, paired with a smoother, more responsive experience in the live graph view.
February 12, 2026
Build Dashboards Faster With the AI Dashboard Builder
Build Dashboards Faster with ControlCom Connect's AI Dashboard Builder
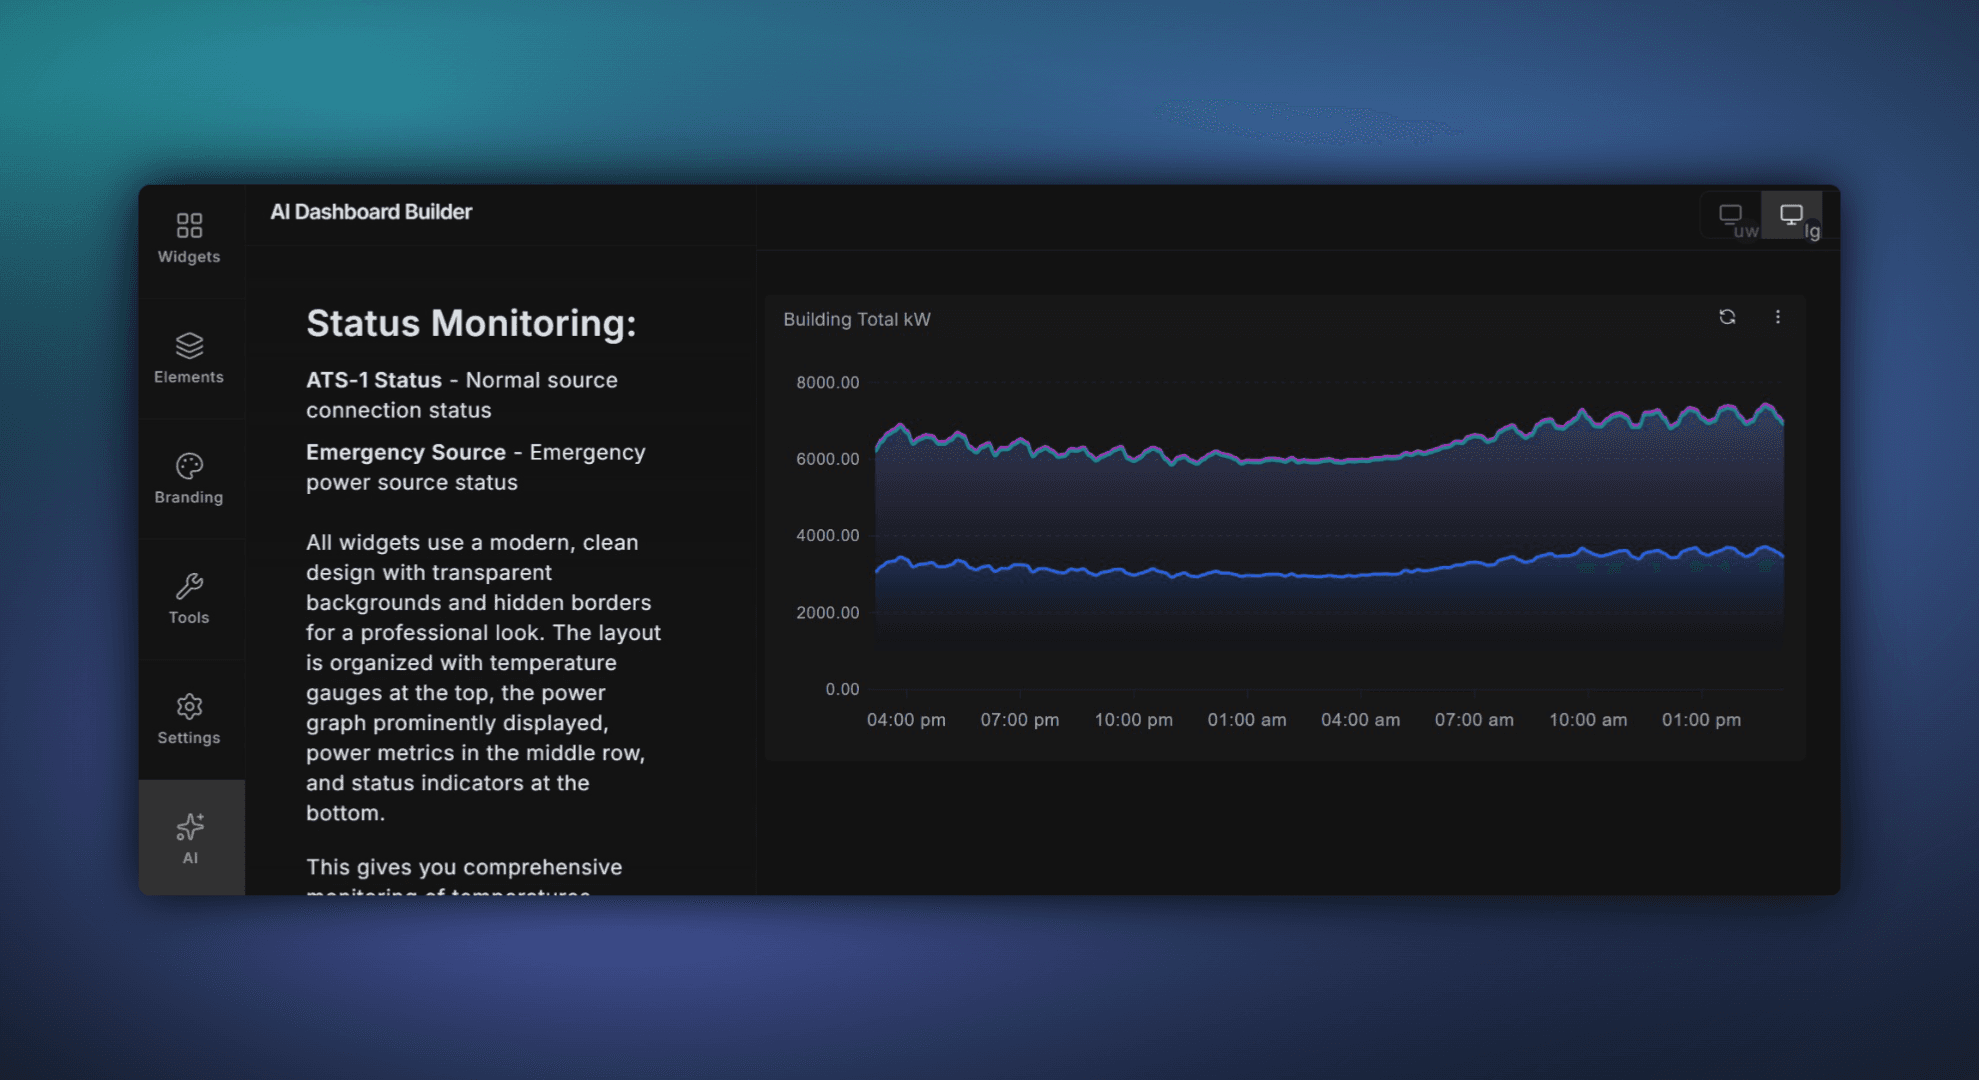
Building dashboards in ControlCom Connect just got a whole lot faster. The new AI Dashboard Builder lets you describe what you want to see — in plain language — and turns it into a working dashboard. It searches your assets, finds the right variables, and lays everything out for you. A few questions, a click, and you're done.
What It Does
Instead of manually searching for data points and dragging widgets onto a canvas, the AI Dashboard Builder handles the heavy lifting. Tell it something like "Show me pump station pressure and flow for the last 24 hours" and it will:
Search your connected assets and find the matching variables automatically
Suggest the right widget types (gauges, trends, tables) based on the data
Build a ready-to-use dashboard layout you can review and customize
Ask follow-up questions if it needs to narrow things down
It works with any asset or variable already in your ControlCom Connect environment — PLCs, SCADA systems, remote I/O, sensors, and everything in between.
Who It's For
This feature is designed for two groups that spend the most time building dashboards: integrators setting up client systems, and plant managers who need custom views for their teams. Whether you're configuring dashboards across dozens of sites or building a morning overview screen for your operators, the AI Dashboard Builder saves you time.
Works Across Industries
The AI Dashboard Builder works with any data already flowing into ControlCom Connect. That means it's ready for the verticals you work in today:
Water & Wastewater: Build operator screens for lift stations, treatment plants, and distribution systems in minutes.
Manufacturing: Get production line dashboards up without waiting on engineering to configure every tag.
Commercial & Industrial: Create building system overviews that pull from HVAC, power, and BMS data sources.
Healthcare: Set up facility monitoring views that track critical environment variables across floors or campuses.
OEM: Build standard dashboards for deployed equipment and customize them per customer.
How to Get Started
The AI Dashboard Builder is available now in ControlCom Connect. To try it out:
Open any project in ControlCom Connect
Click "New Dashboard" and select the AI Dashboard Builder option
Describe what you want to see
Review, adjust, and save
That's it. No training required. If you can describe what you need, you can build it.
January 15, 2026
Bulk Variable Replacement and a New Text Widget
Find and Replace Variables Across Your Dashboard
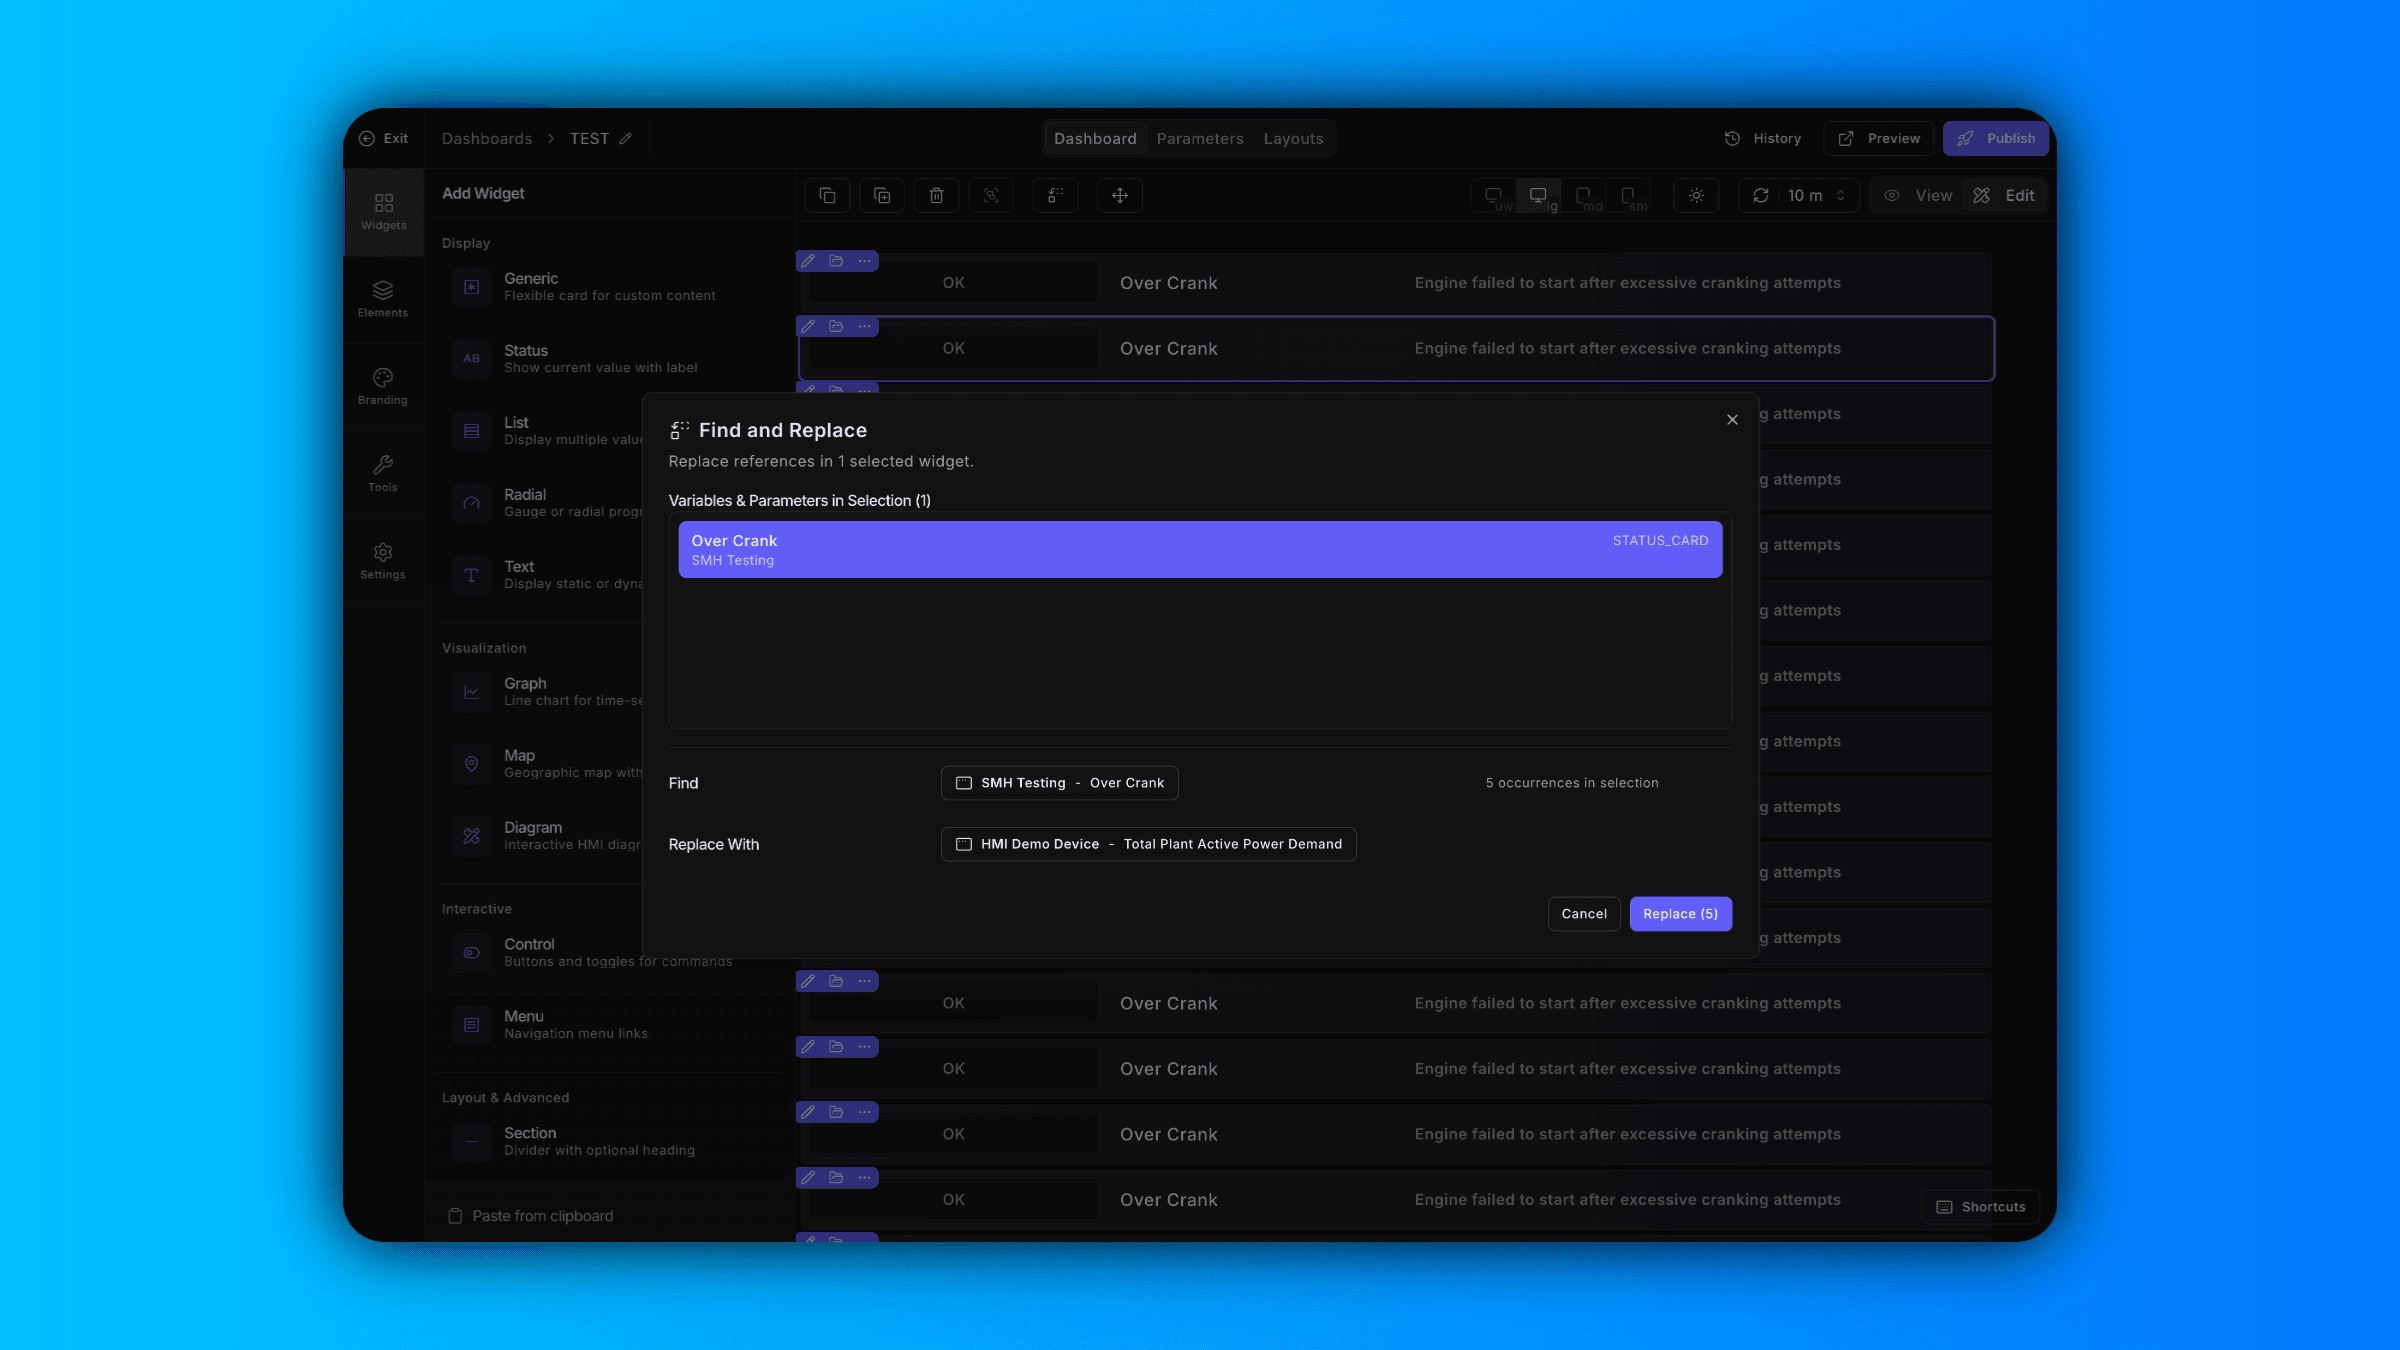
Updating variables one widget at a time slows you down. Now in ControlCom Connect, you can find and replace variables in bulk directly from the dashboard editor.
Select specific widgets to update just what you need, or select the entire dashboard to swap variables across every widget at once. This is especially useful when you're cloning dashboards for new sites, reassigning tags after a PLC migration, or standardizing naming conventions across your facility.
What used to take 20 clicks now takes two.
New Text Widget for Static or Dynamic Content
The dashboard editor now includes a text widget that renders static text or pulls dynamic values from a variable.
Use it to add section headers, display real-time status messages, show calculated values, or label dashboard regions for clearer navigation. Integrators can build more informative dashboards without workarounds, and plant managers get dashboards that communicate context—not just data.
Keyboard Shortcuts Now in the Menu
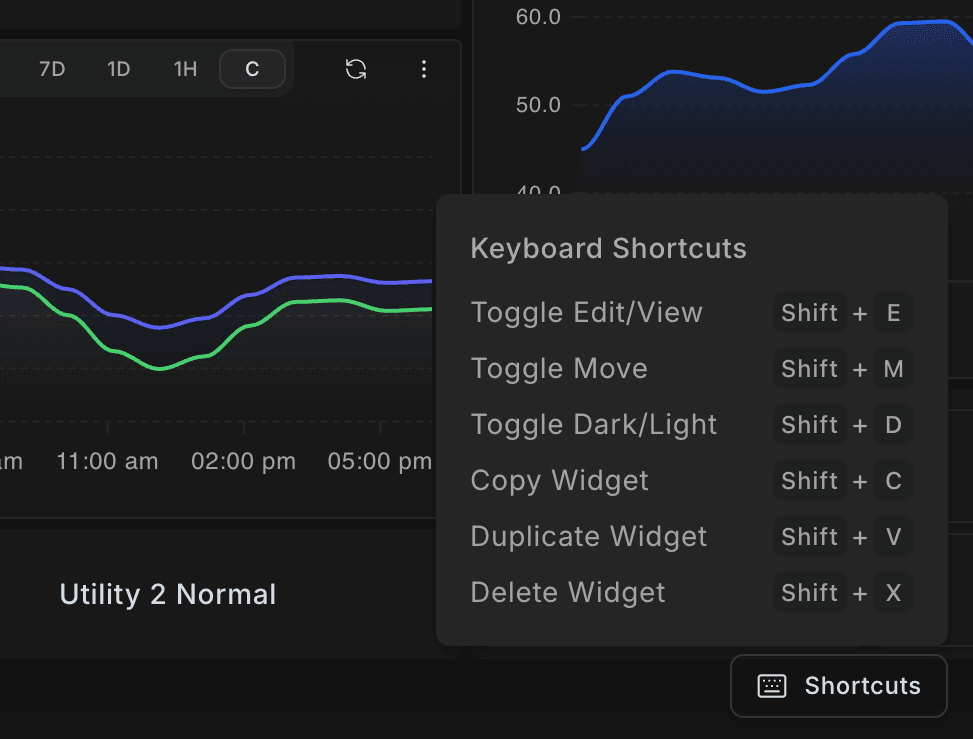
Every keyboard shortcut is now available as a button in the editor menu. If you prefer clicking over key combos—or just need a reminder of what's available—it's all visible and accessible in one place.
December 29, 2025
Faster Dashboard Editing with Keyboard Shortcuts
What's New
Building dashboards in ControlCom Connect just got faster. This update brings keyboard shortcuts, multi-widget selection, and smoother navigation to the dashboard editor.
Keyboard Shortcuts
New keyboard shortcuts let you switch modes, copy widgets, and manage selections without reaching for your mouse. A Shortcuts button in the bottom-right corner of the editor shows all available commands.
Multi-Select Widgets
Select multiple widgets at once by holding Shift and clicking. Once selected, duplicate or delete your entire selection in one action—no more editing widgets one at a time.
Why It Matters
For integrators managing dozens of dashboards across sites, these updates mean less time clicking through menus and more time focused on what matters: keeping operations running. Small workflow improvements add up—especially when you're building dashboards for water systems, manufacturing floors, or distributed OEM equipment.
December 27, 2025
Preview Dashboards with Simulated Data in ControlCom Connect
What's New
ControlCom Connect now lets you simulate data on any dashboard, even when your variables have no live values. You can see exactly how your final design will look with realistic data flowing through charts, gauges, and widgets.
No more guessing. No more waiting for equipment to come online.
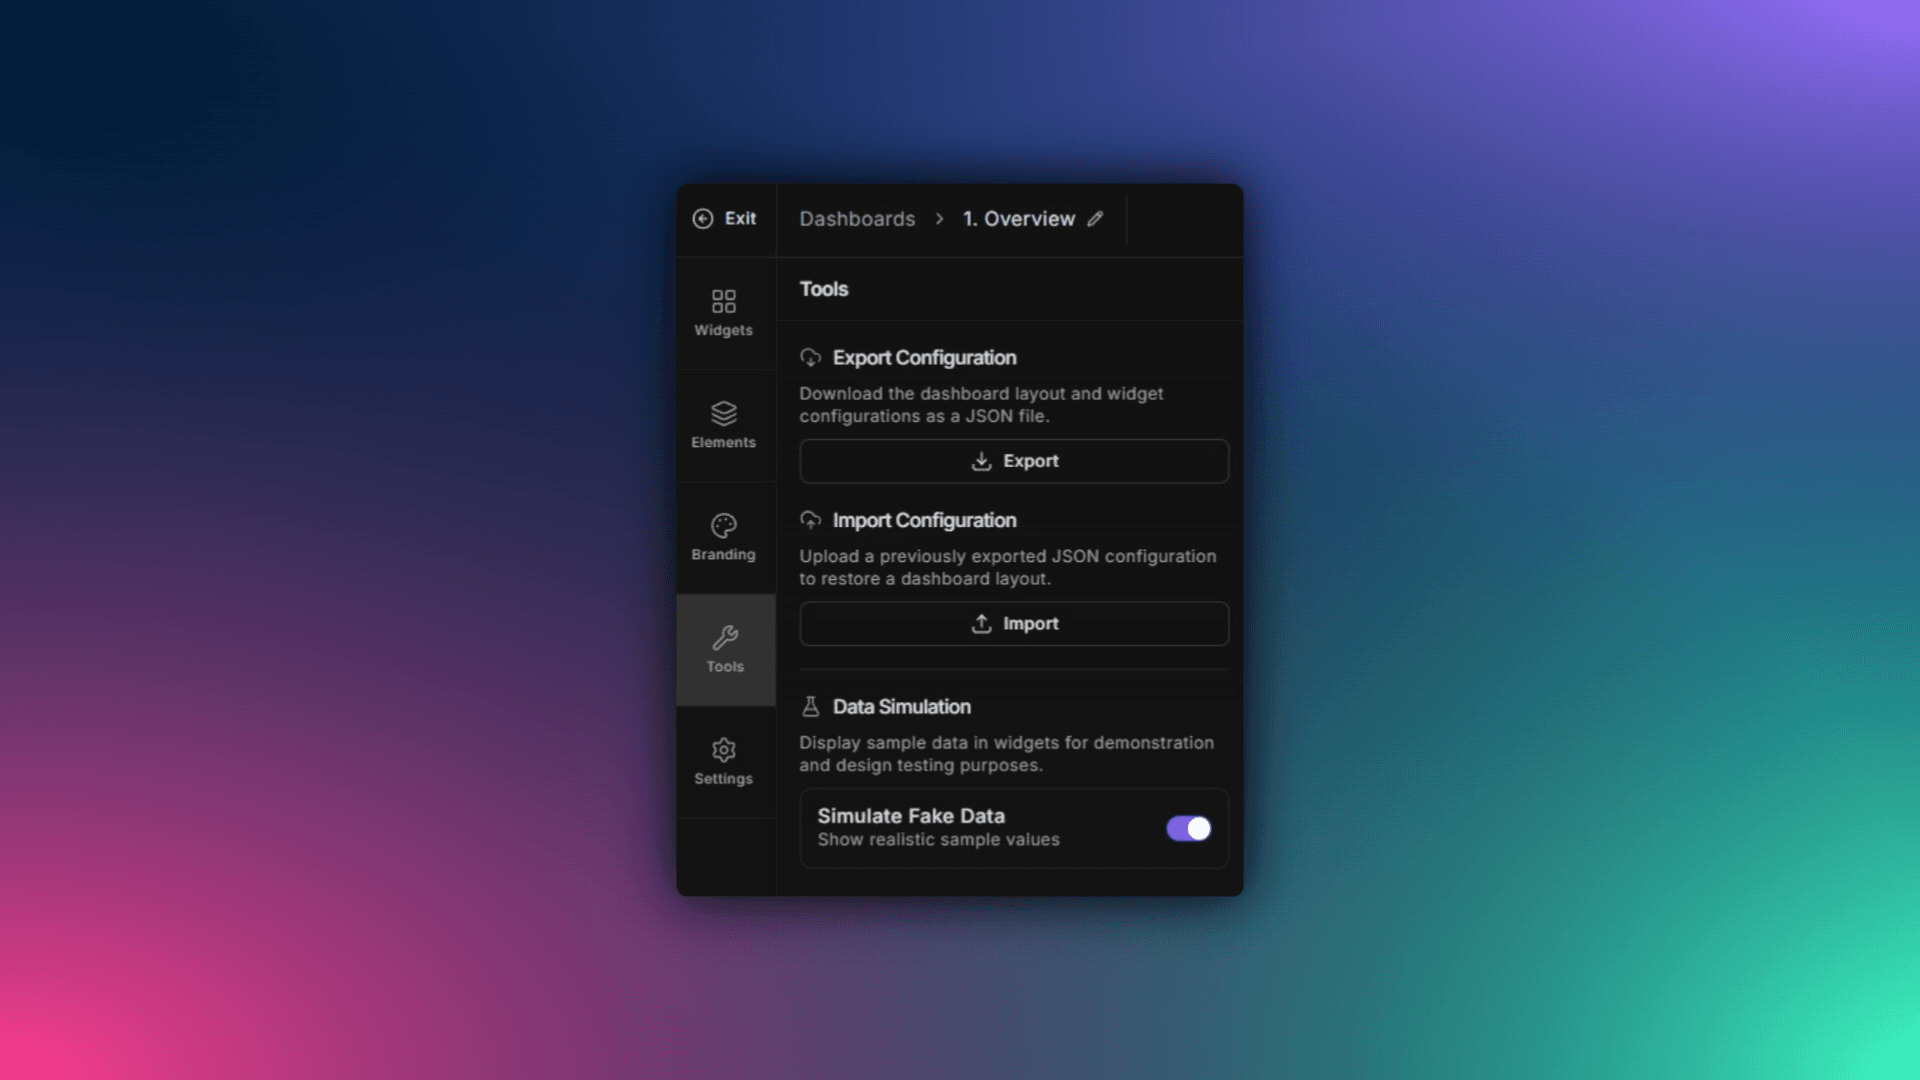
How It Works
Enable simulation mode: Toggle simulated data on any dashboard from the designer's Tools tab.
See your layout in action: Widgets populate with representative values so you can evaluate spacing, thresholds, and visual balance
Build demo accounts: Create polished, fully-functional demos for prospective clients or internal stakeholders without connecting to real assets
Why It Matters
For integrators building customer-facing dashboards, this means you can finalize designs before a single PLC is wired. For OEMs creating demo environments, you get a realistic showcase without shipping test equipment.
Whether you're pitching a new SCADA monitoring project or onboarding a water utility, simulated data helps you present a finished product—not a placeholder.